Release notes 26.4
HIGHLIGHTS
- Notifications reworked — intentional following, periodic digests, a redesigned notification panel, and delivery to Microsoft Teams and Slack
- Bulk import and update assets in Portal — create and update Glossary terms and data source assets in bulk from spreadsheets
- Export to HTML — share a standalone, browsable copy of your documentation, configured in a new step-by-step export wizard
- Folders — group data sources and reporting sources into folders
- Data Lineage improvements — frames for data source, Domain, Area, and Data Product diagrams, and a new Data lineage tab for Domains, Areas, and Data Products
- Data Quality Rule testing — test rules before saving, and add columns from related tables to failed rows
- ERD improvements — a new Relationships panel, and editable diagrams for Domains, Data Products, and data sources
- Multiple AI providers — configure AI engines from OpenAI, Anthropic, Google, Mistral, xAI, Amazon Bedrock, Azure, or any OpenAI-compatible endpoint
- Power BI — Dataflow Gen2 support and column-level lineage through Power Query (M) steps
- Other changes — default tasks and recommended settings in the Scheduler, login method binding, SAML Single Logout, a new Assets section, dashboards on native widgets, PK/FK tester improvements, searchable users, an option to turn off SMTP, a troubleshooting-focused Import Summary, and deeper Domain nesting
- UI & UX changes — long names shortened in the middle, clickable badges, a unified History of changes, a floating bulk action bar, redesigned side panels, and a refreshed homepage
Notifications
Version 26.4 brings a rework to Notifications. While the underlying experience and logic stay similar, we wanted to focus on improving the efficiency of notifications and reducing spam. The biggest changes include the introduction of digests, changes to following rules, and adding the option to integrate notifications with your company's messaging app.
Digest
Starting with this version, the Digest function lets you gather some of the task notifications into a long-form, exhaustive report that is sent to you daily or weekly.
Digest settings are configured per user. This means that each user can select what exactly is included in their personal digest — someone might use it to create a daily report of repository changes, someone else might be interested in weekly updates on schema changes or results of scheduled tasks, and yet another person might use the Digest to compile event updates that get too frequent as regular notifications.
Digest can compile information for the same event types used by notifications. At the same time, the Digest does not replace notifications — you can receive the same information both as part of the Digest and as individual notifications, or receive only notifications without a related Digest entry, or vice versa.
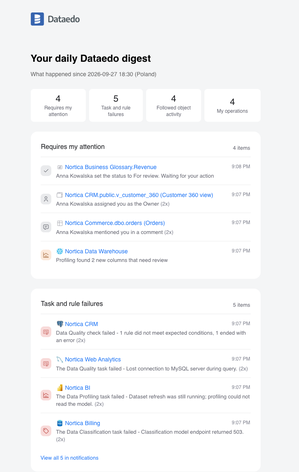
Since the Digest takes the form of long-form text, you can receive it only via email or an integrated messaging app.
Notifications reworked
Objects followed automatically prior to version 26.4 will not be automatically removed from your followed objects
We changed how notifications and following work. The shortest way to describe the changes is that following an object is now always intentional, and notifications feel more streamlined and focused. If you are interested in a more detailed breakdown, read below.
Following
In previous versions of Dataedo, following an object could be manual, but could also happen automatically under certain circumstances (e.g., if you were mentioned somewhere or assigned a role on an object). While in theory this approach could help you stay on top of all actions and objects relevant for your daily work, in practice it ended up creating notifications for events you did not expect, and the volume of notifications could get overwhelming very quickly.
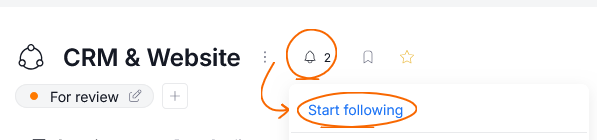
This is why, from version 26.4, the main way of following an object requires manual input, using the bell icon.
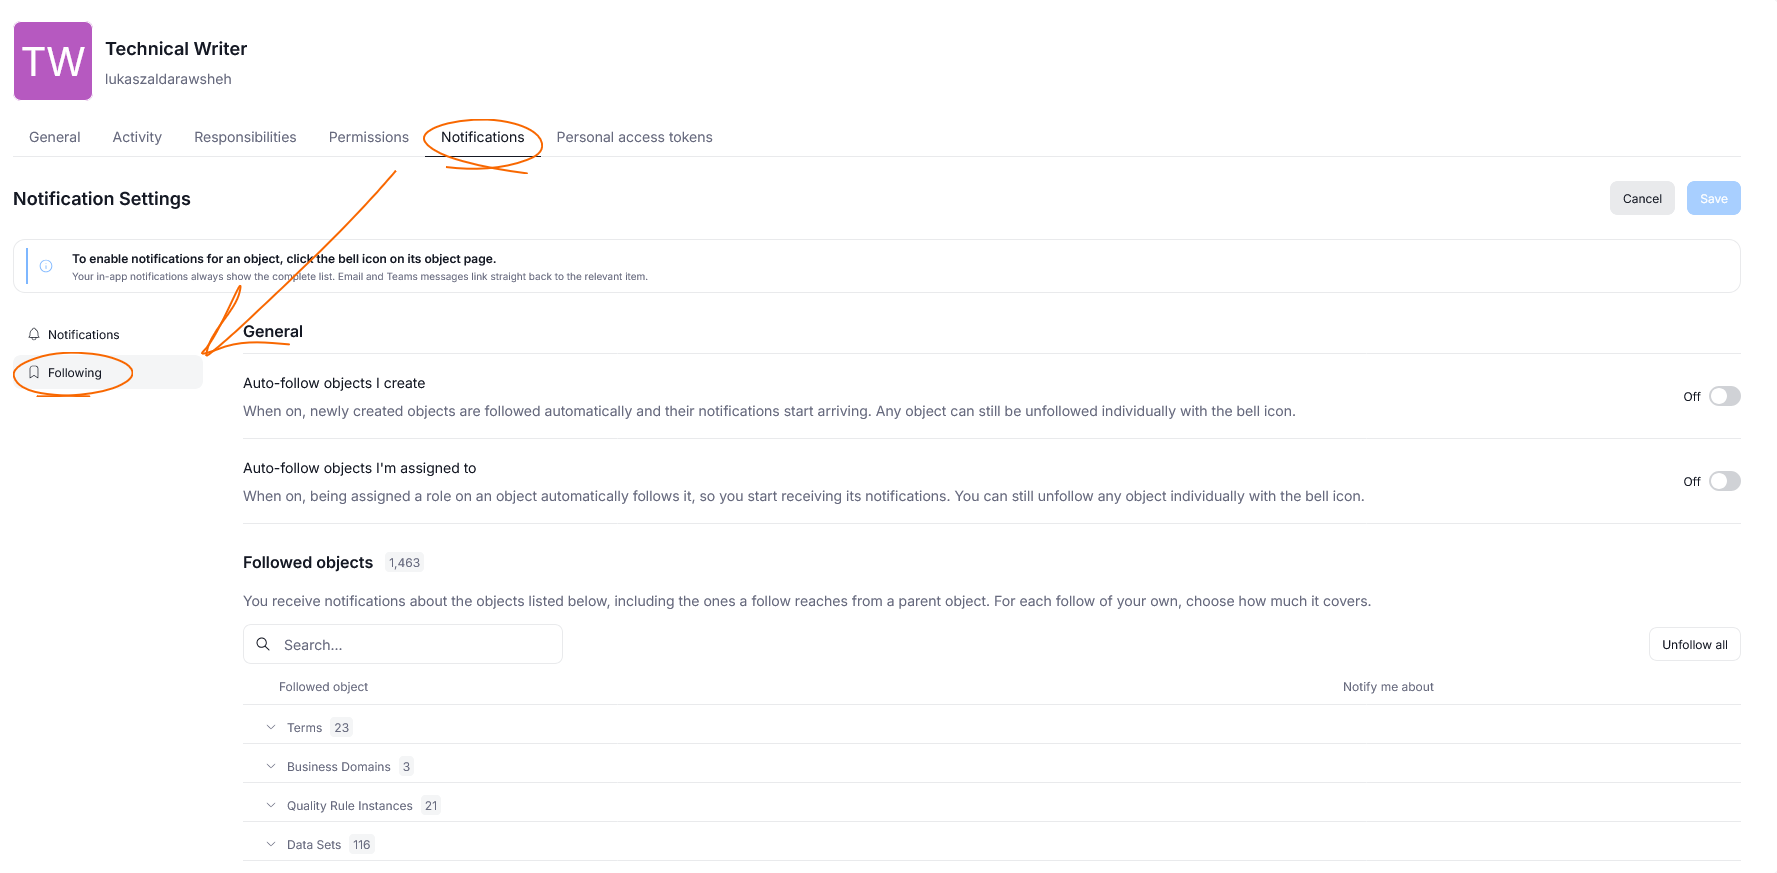
The Followed objects section also received a refreshed look, and you can access it directly from the Notifications tab of your user profile settings. There, you can also optionally set auto-following rules.
Only three interactions still trigger automatic object following, regardless of your settings:
- follows cascading to child objects when you modify Domains and Data Products
- creating manual databases and reporting sources
- creating a Data Quality Rule Instance
Workflows do not cause automatic follows, but might still send you notifications regarding objects you are not following — if you need to take action on a given object because its workflow status changed and you are the assignee, you will be notified
Settings
The notification settings page has been reworked.
We added a new section [A], where you can configure your Digest settings. We also added a new column [B] to notification preferences, where you can decide whether a given event should be included in your digest.
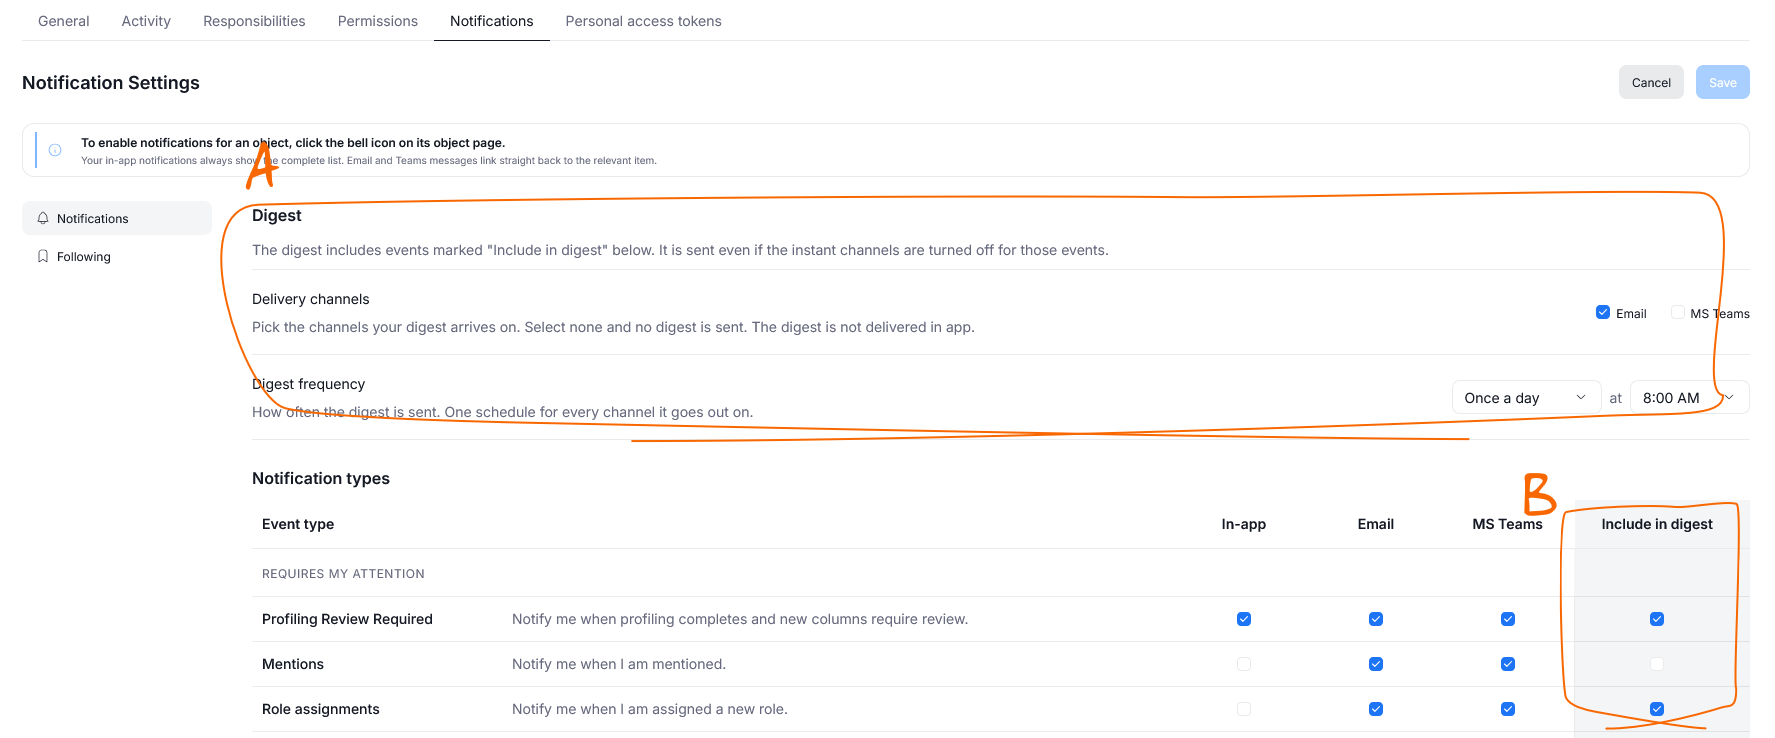
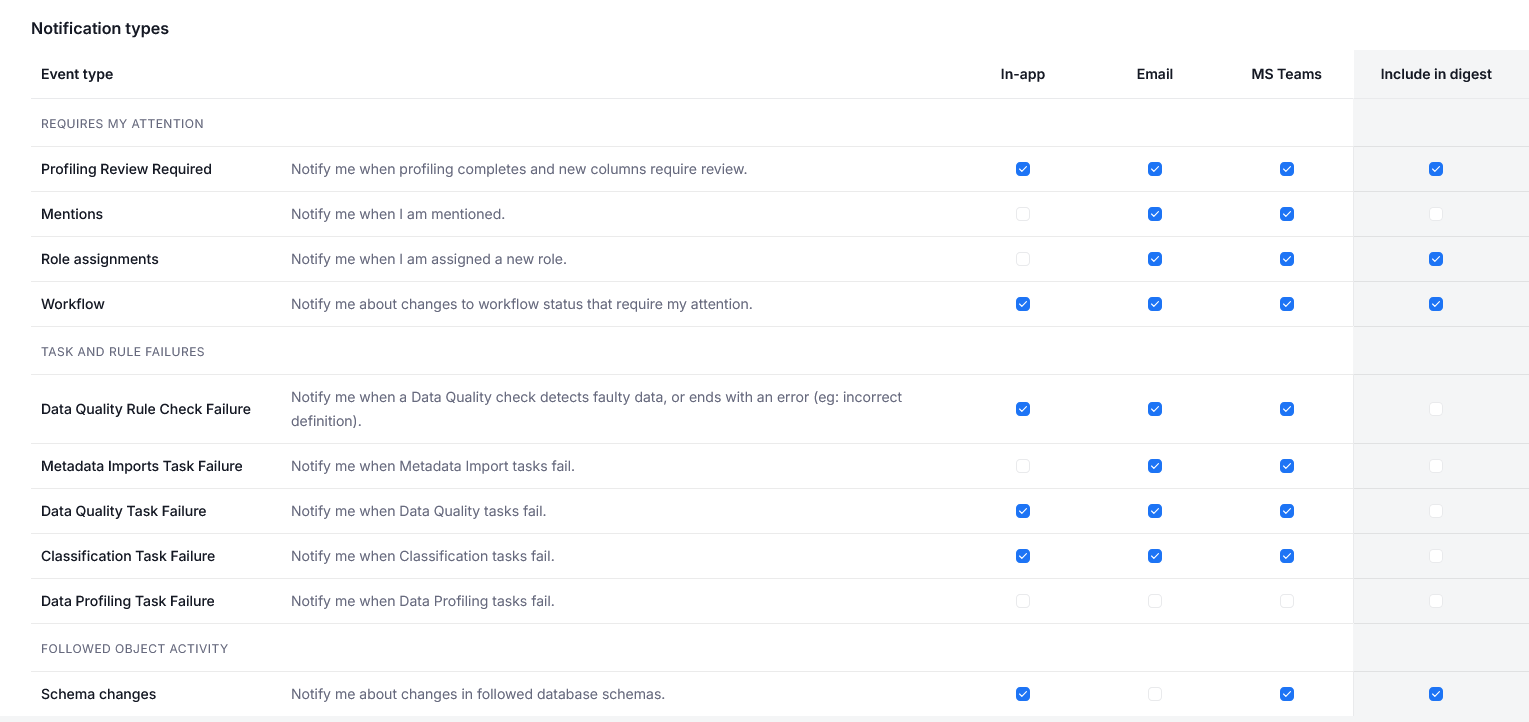
Notification events have also been slightly tweaked, and are now grouped by type.
Notification view in Portal
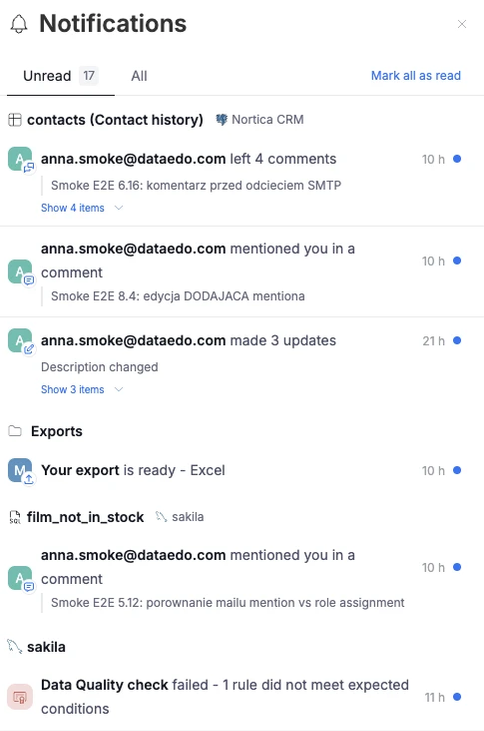
The in-app notification panel has been redesigned, with our main goal being making it always easily readable, no matter the number of notifications.
Notifications are now grouped by object to avoid spamming the panel with multiple near-identical rows. Each group is headed by the object's icon, name, and source. Object edits and comment threads are collapsed into single entries that can be expanded with Show N items.
App integrations
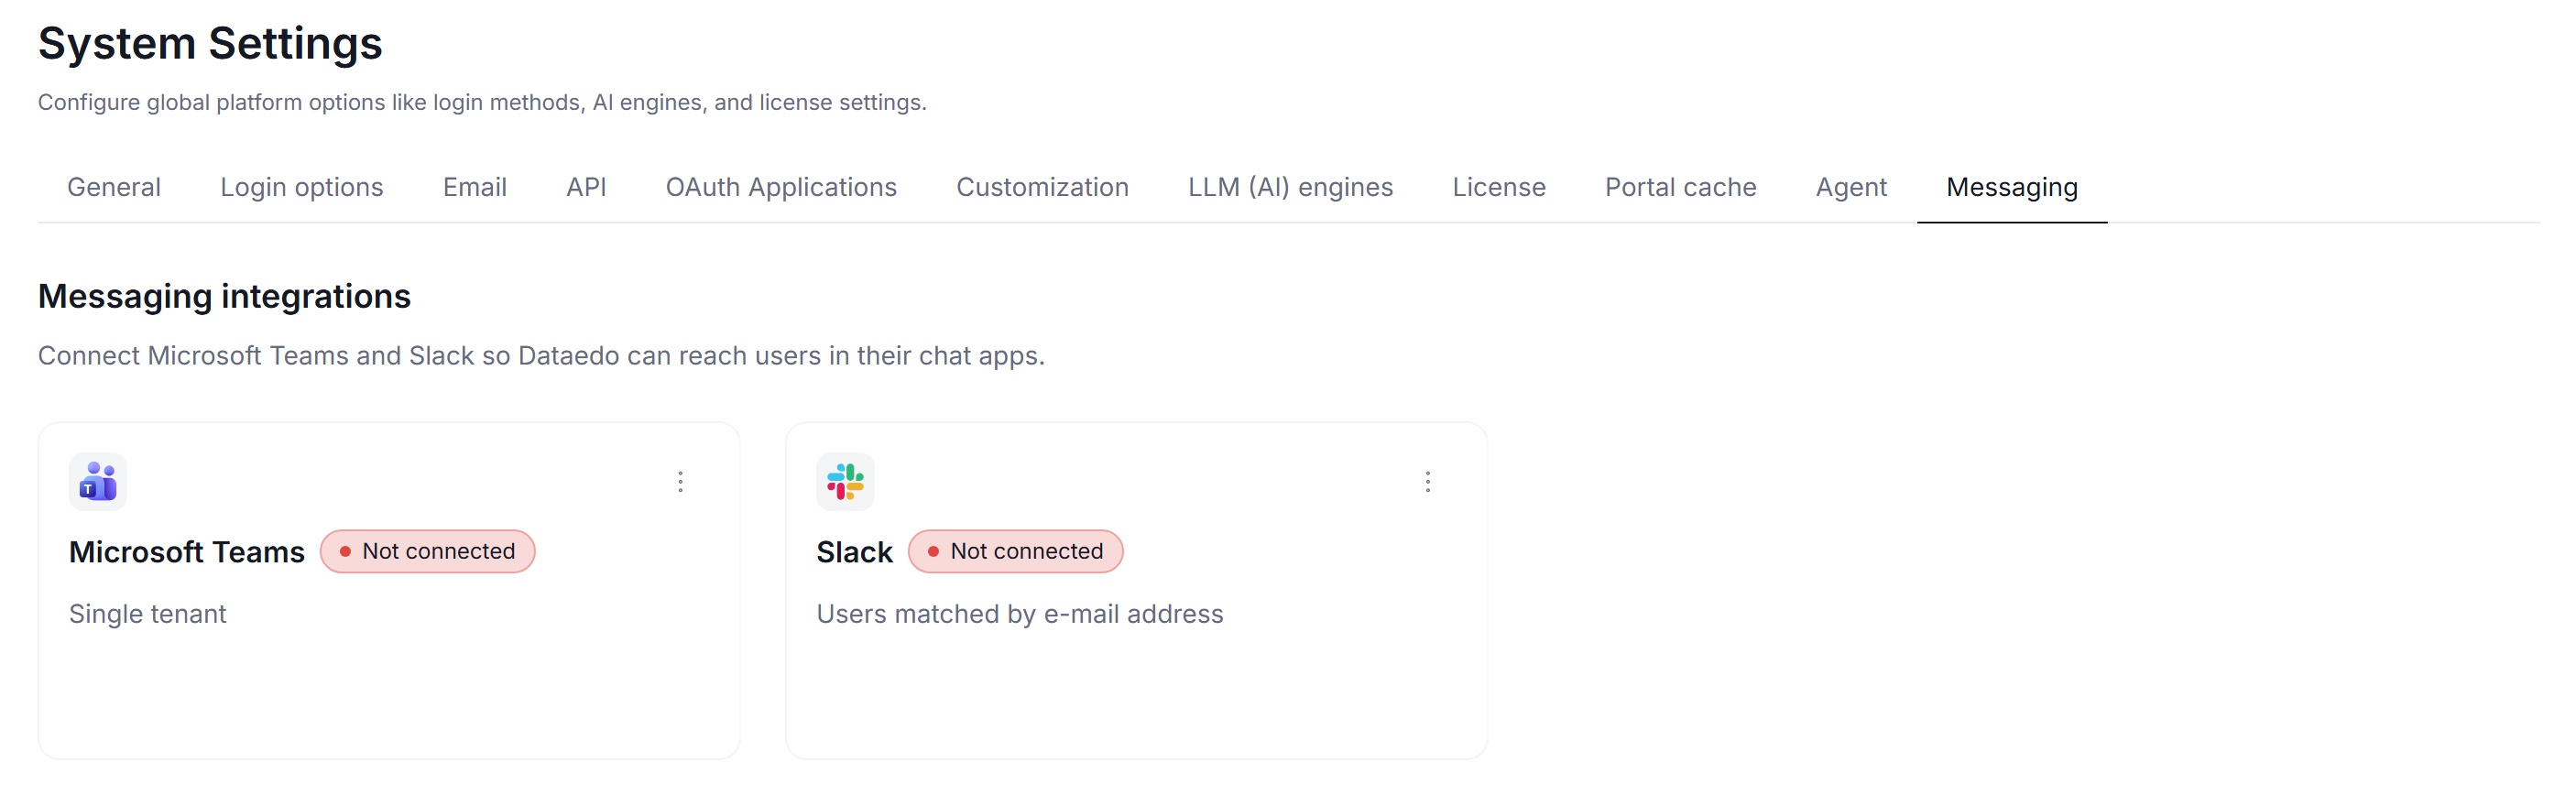
Notifications can now reach you directly in Microsoft Teams and Slack, alongside email and in-app delivery. Admins manage these integrations in the new Messaging tab, under Settings > System Settings. Once an integration is set up, a new column appears in your notification preferences — you decide event by event what gets delivered to your chat, exactly like you do for the other channels. You can also use both apps as a delivery channel for your Digest.
Notifications in messaging apps respect the same permissions as every other channel, so you will only ever be notified about objects you have access to. Delivery is matched by email address — your account in the messaging app has to use the same address as your Dataedo account.
Microsoft Teams
Teams notifications are delivered by the Dataedo Teams bot. Setting the bot up is an Admin task and requires Admin permissions in both Dataedo and Microsoft Azure. Read the full setup instructions in our article on Microsoft Teams notifications.
Slack
Slack notifications are delivered as direct messages from the Dataedo app. Each message links straight to the object in Dataedo and to your notification settings.
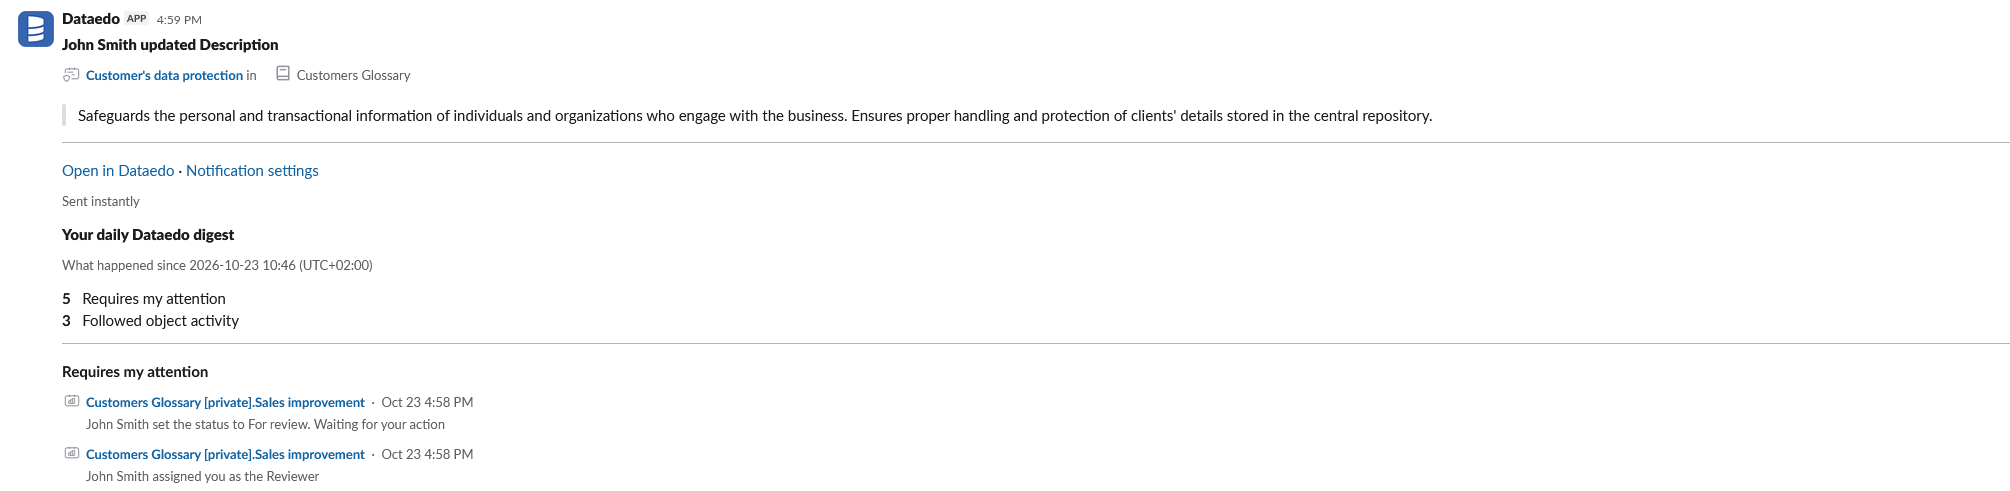
The integration is set up once by an Admin — users do not need to install or link anything themselves. Learn more here.
Bulk import and update assets in Portal
You can now create and update many objects at once by uploading a spreadsheet, instead of editing them one by one. This function is available for data sources and Glossaries.
Glossary terms
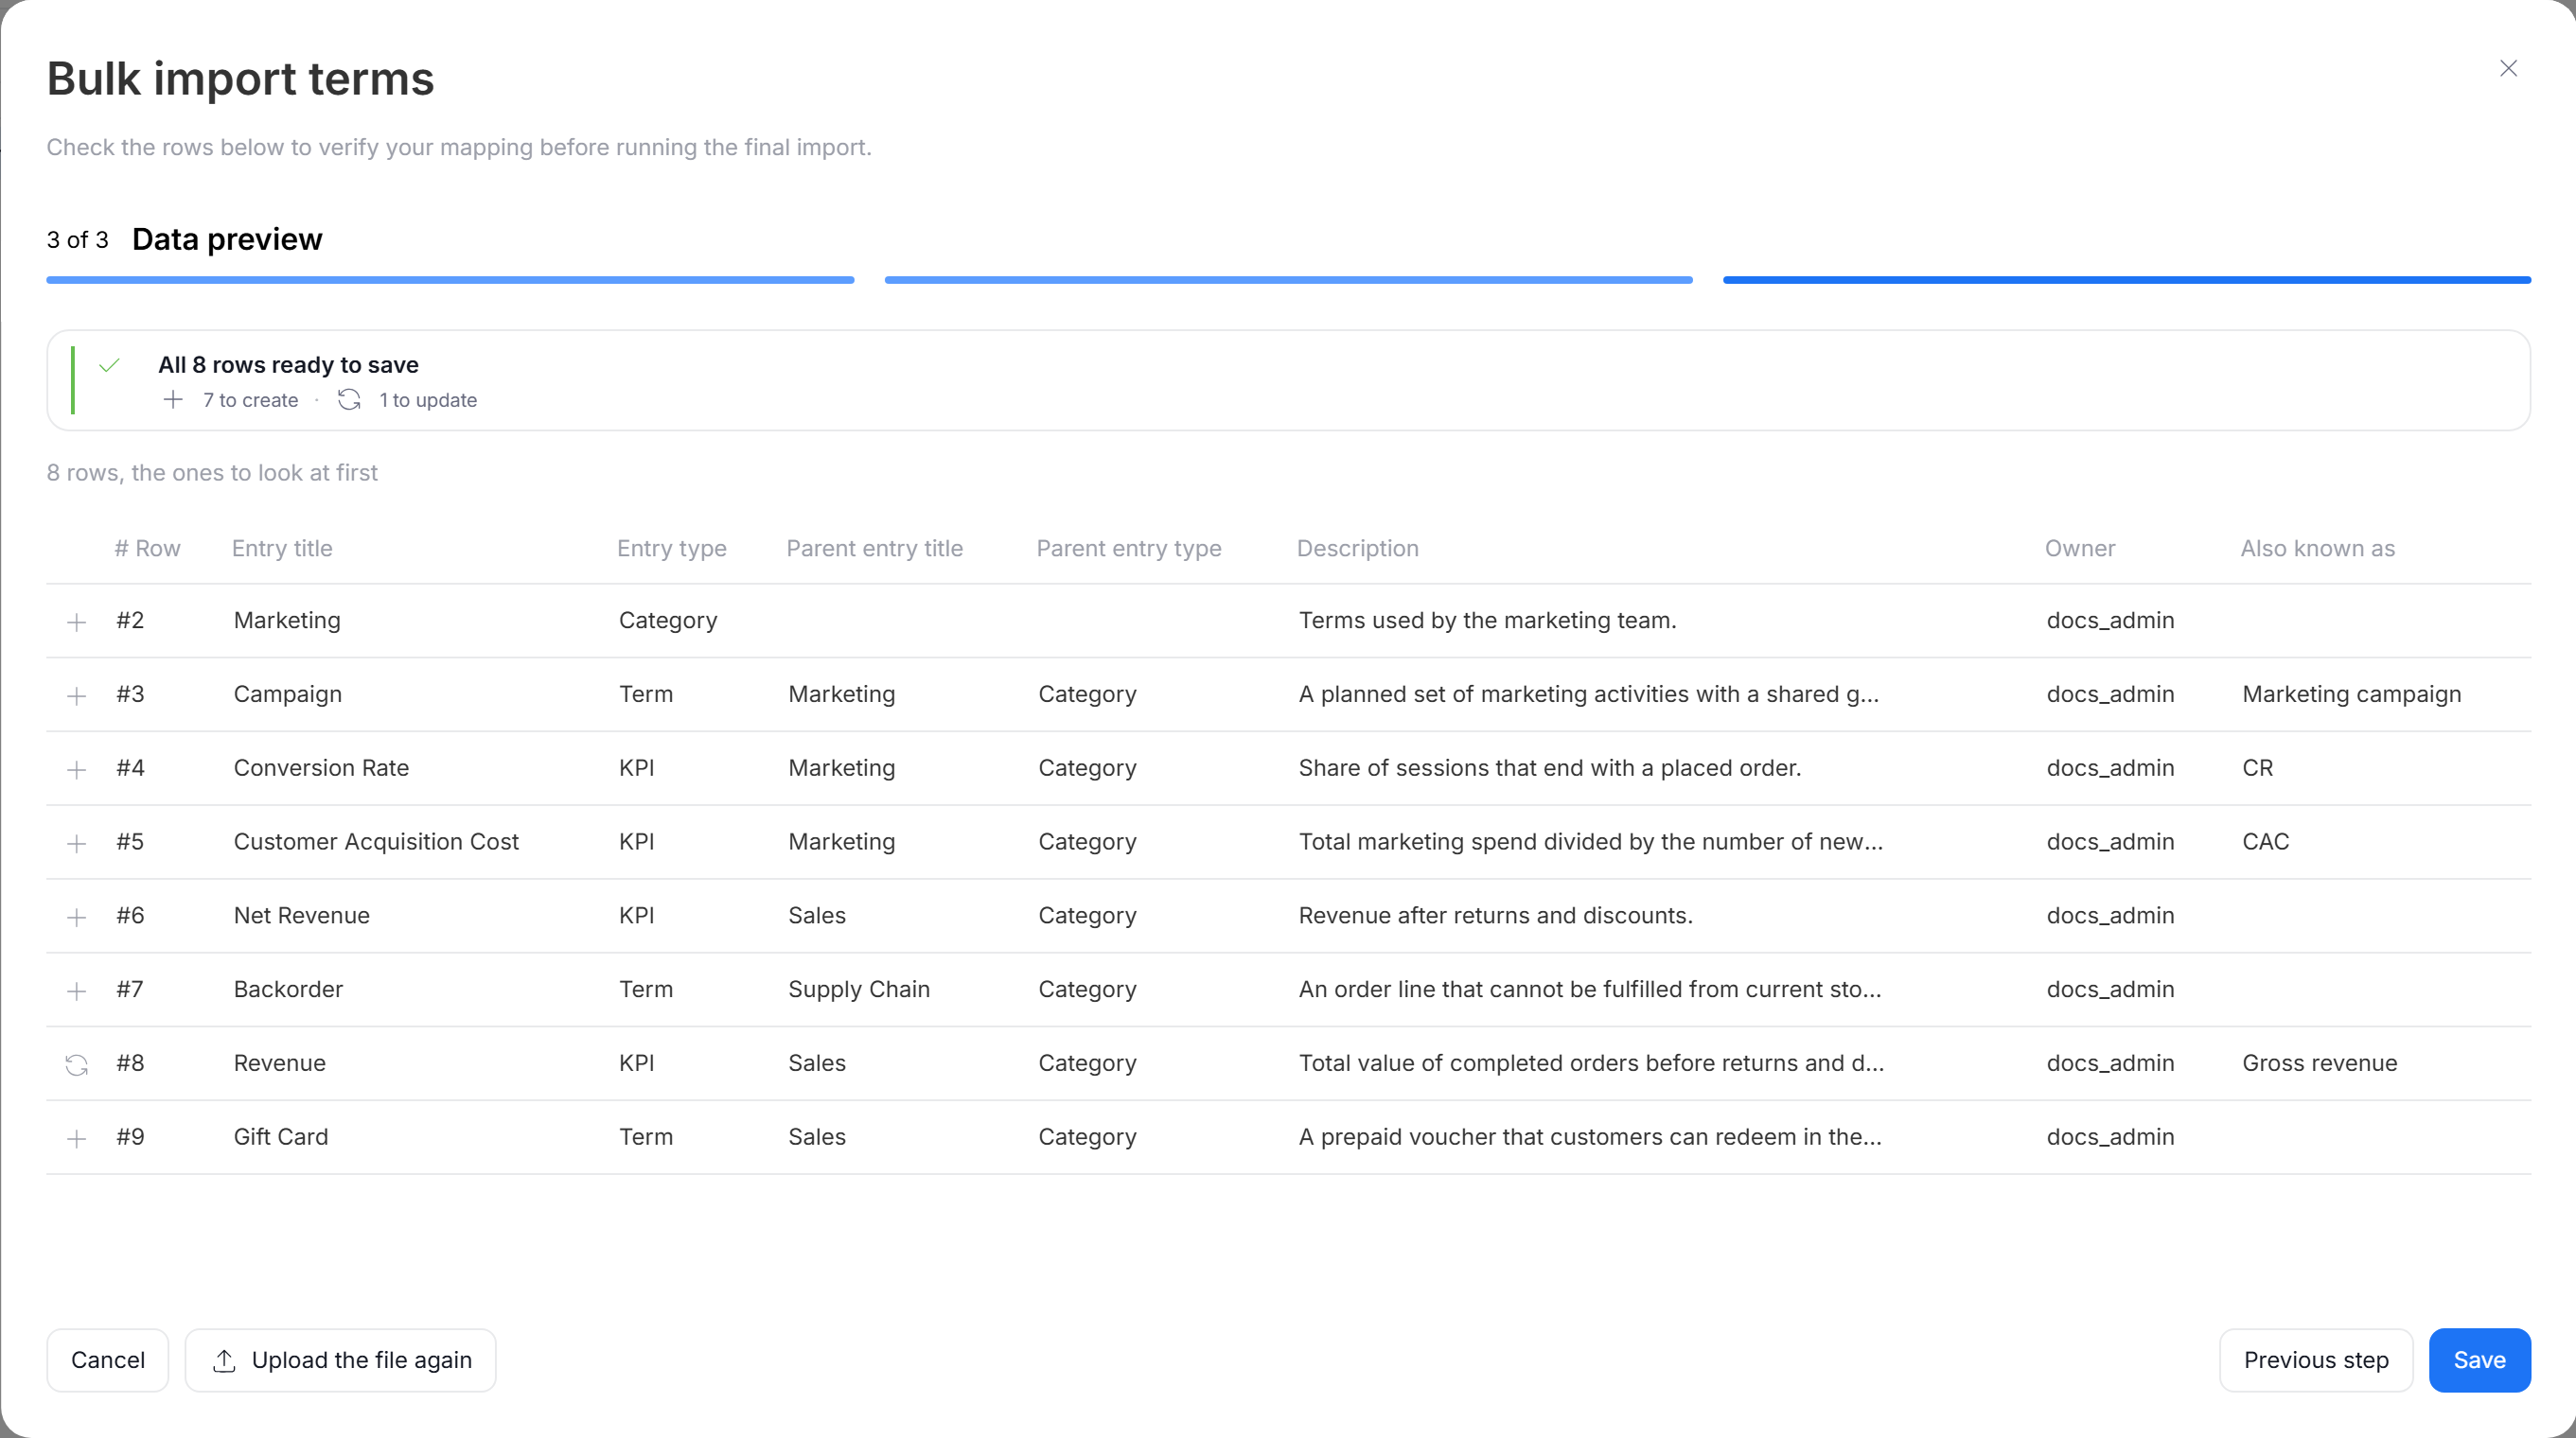
Bulk import terms lets you create new Glossary terms, together with their hierarchy, and update the title, entry type, description, parent, and Custom Fields of existing ones. Start it from the Glossary's three dots menu, or with + in the Glossary sidebar, and upload an Excel, CSV, or TSV file. You can fill in a template, or export the Glossary to Excel, edit it, and upload it back. Learn more here.
Data sources
Data sources and reporting sources get two new actions, available from the source's three dots menu or with + in the catalog sidebar:
- Bulk add assets — creates new manual assets (data sets, programs, and reports) together with their columns and parameters.
- Bulk update assets — updates descriptions and Custom Fields of existing assets, columns, and parameters.
Export to HTML
We expanded export in Portal to include HTML. The result of an HTML export is a standalone, read-only copy of your documentation that looks and navigates like a slice of your Portal — complete with ERDs, badges, linked assets, and other content that does not fit in a spreadsheet. It is an easy way to share documentation with people who do not use Dataedo.
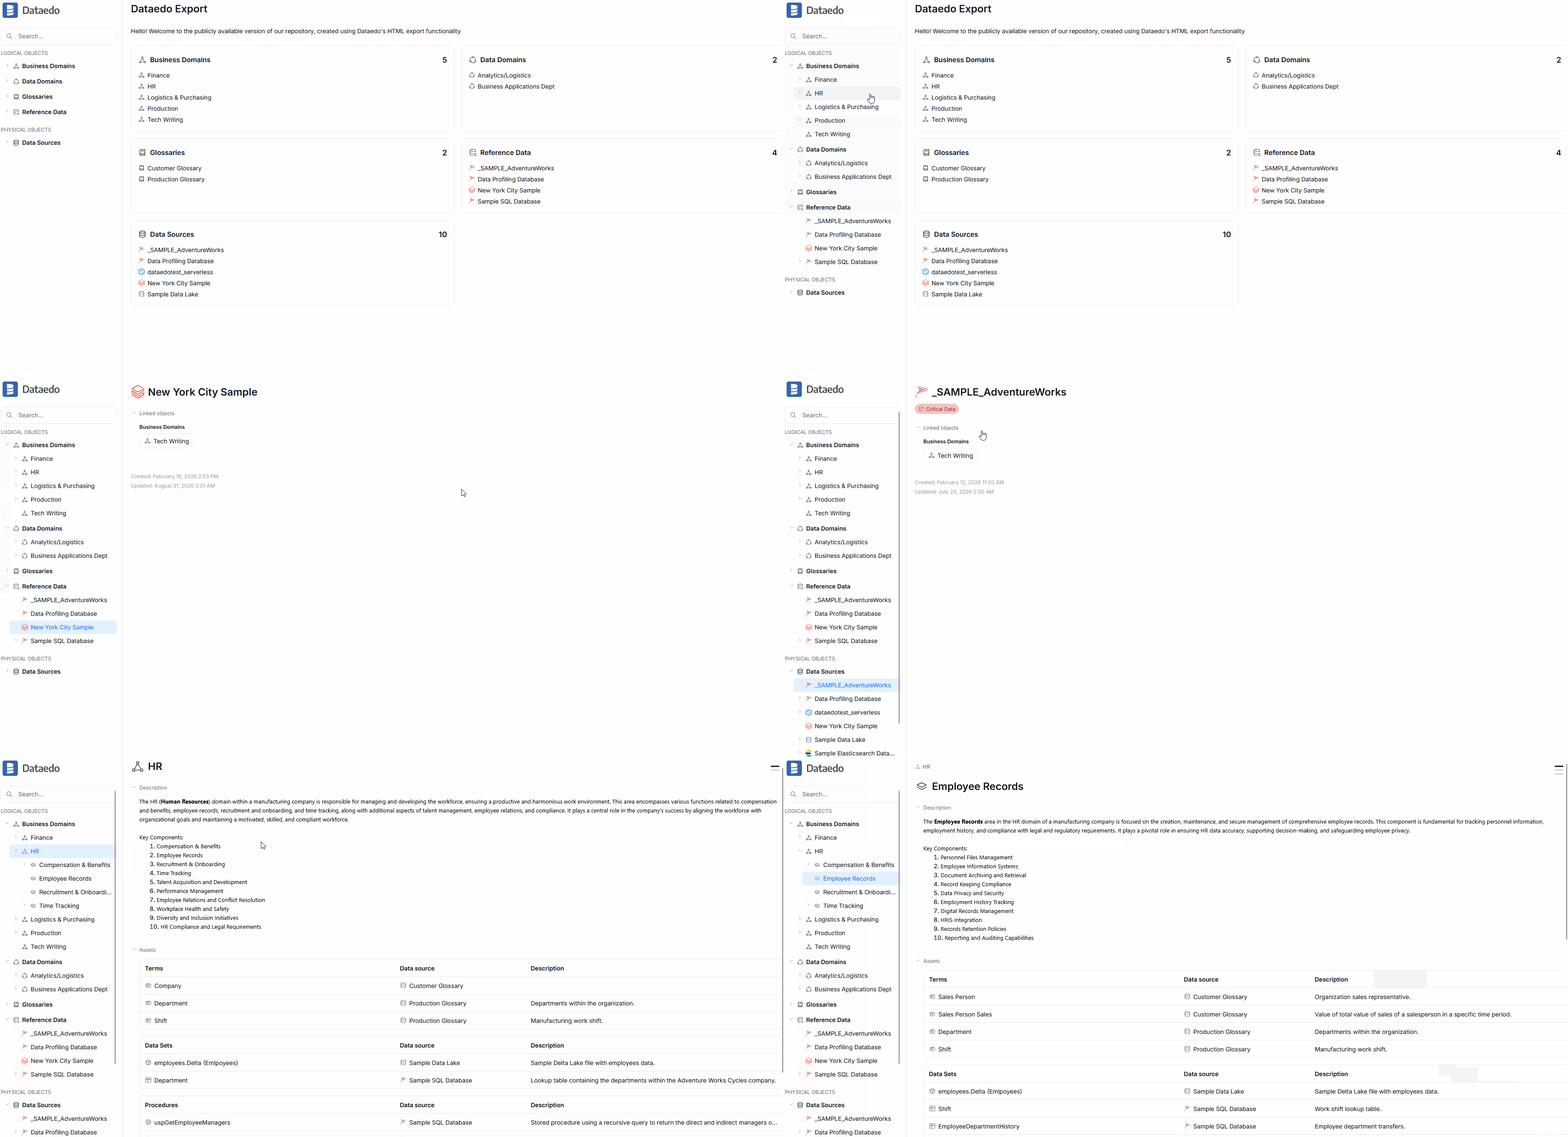
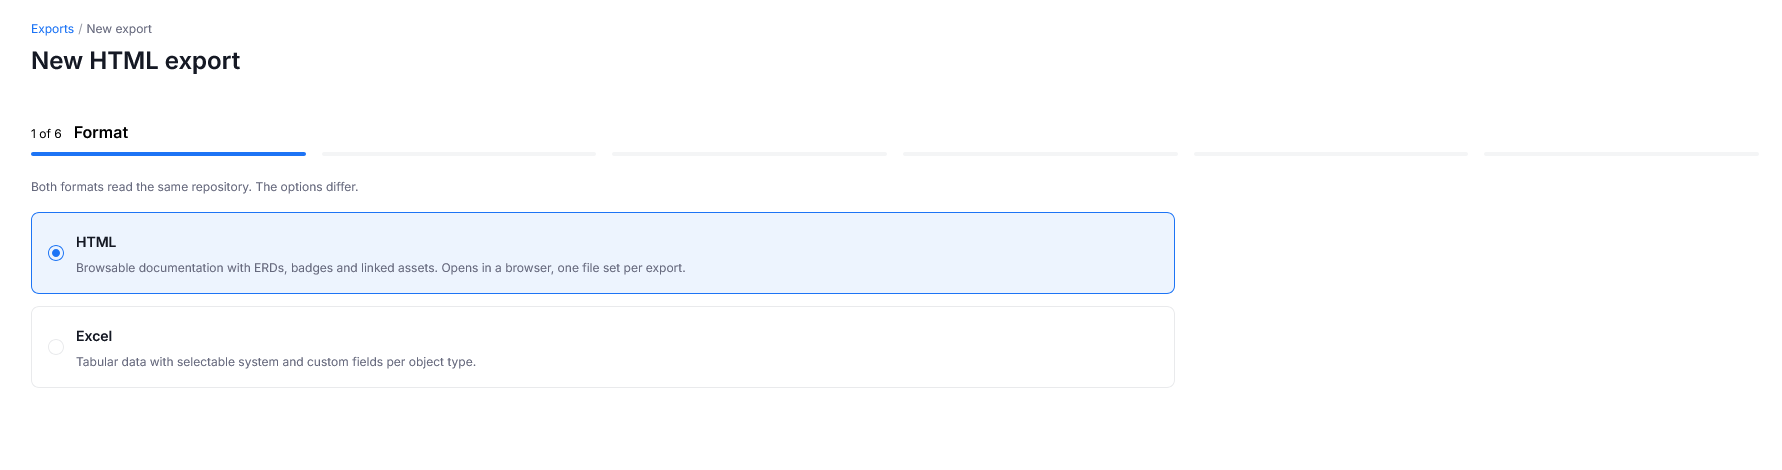
Adding HTML as a second format also called for a dedicated export UI. Exports now have their own Exports section in the main navigation, and the whole process is guided by a user-friendly, step-by-step wizard — you first choose the format, then the scope, and then the content to include. HTML exports can also include introduction text and hide all people data.
Folders
Version 26.4 also brings data sources and reporting instances together into one new category in the main navigation — Assets
You can now group data sources and reporting sources into folders — for example by environment, layer, or team — instead of relying on naming prefixes. Folders are shown on the Catalog Assets page and at the top of the catalog sidebar.
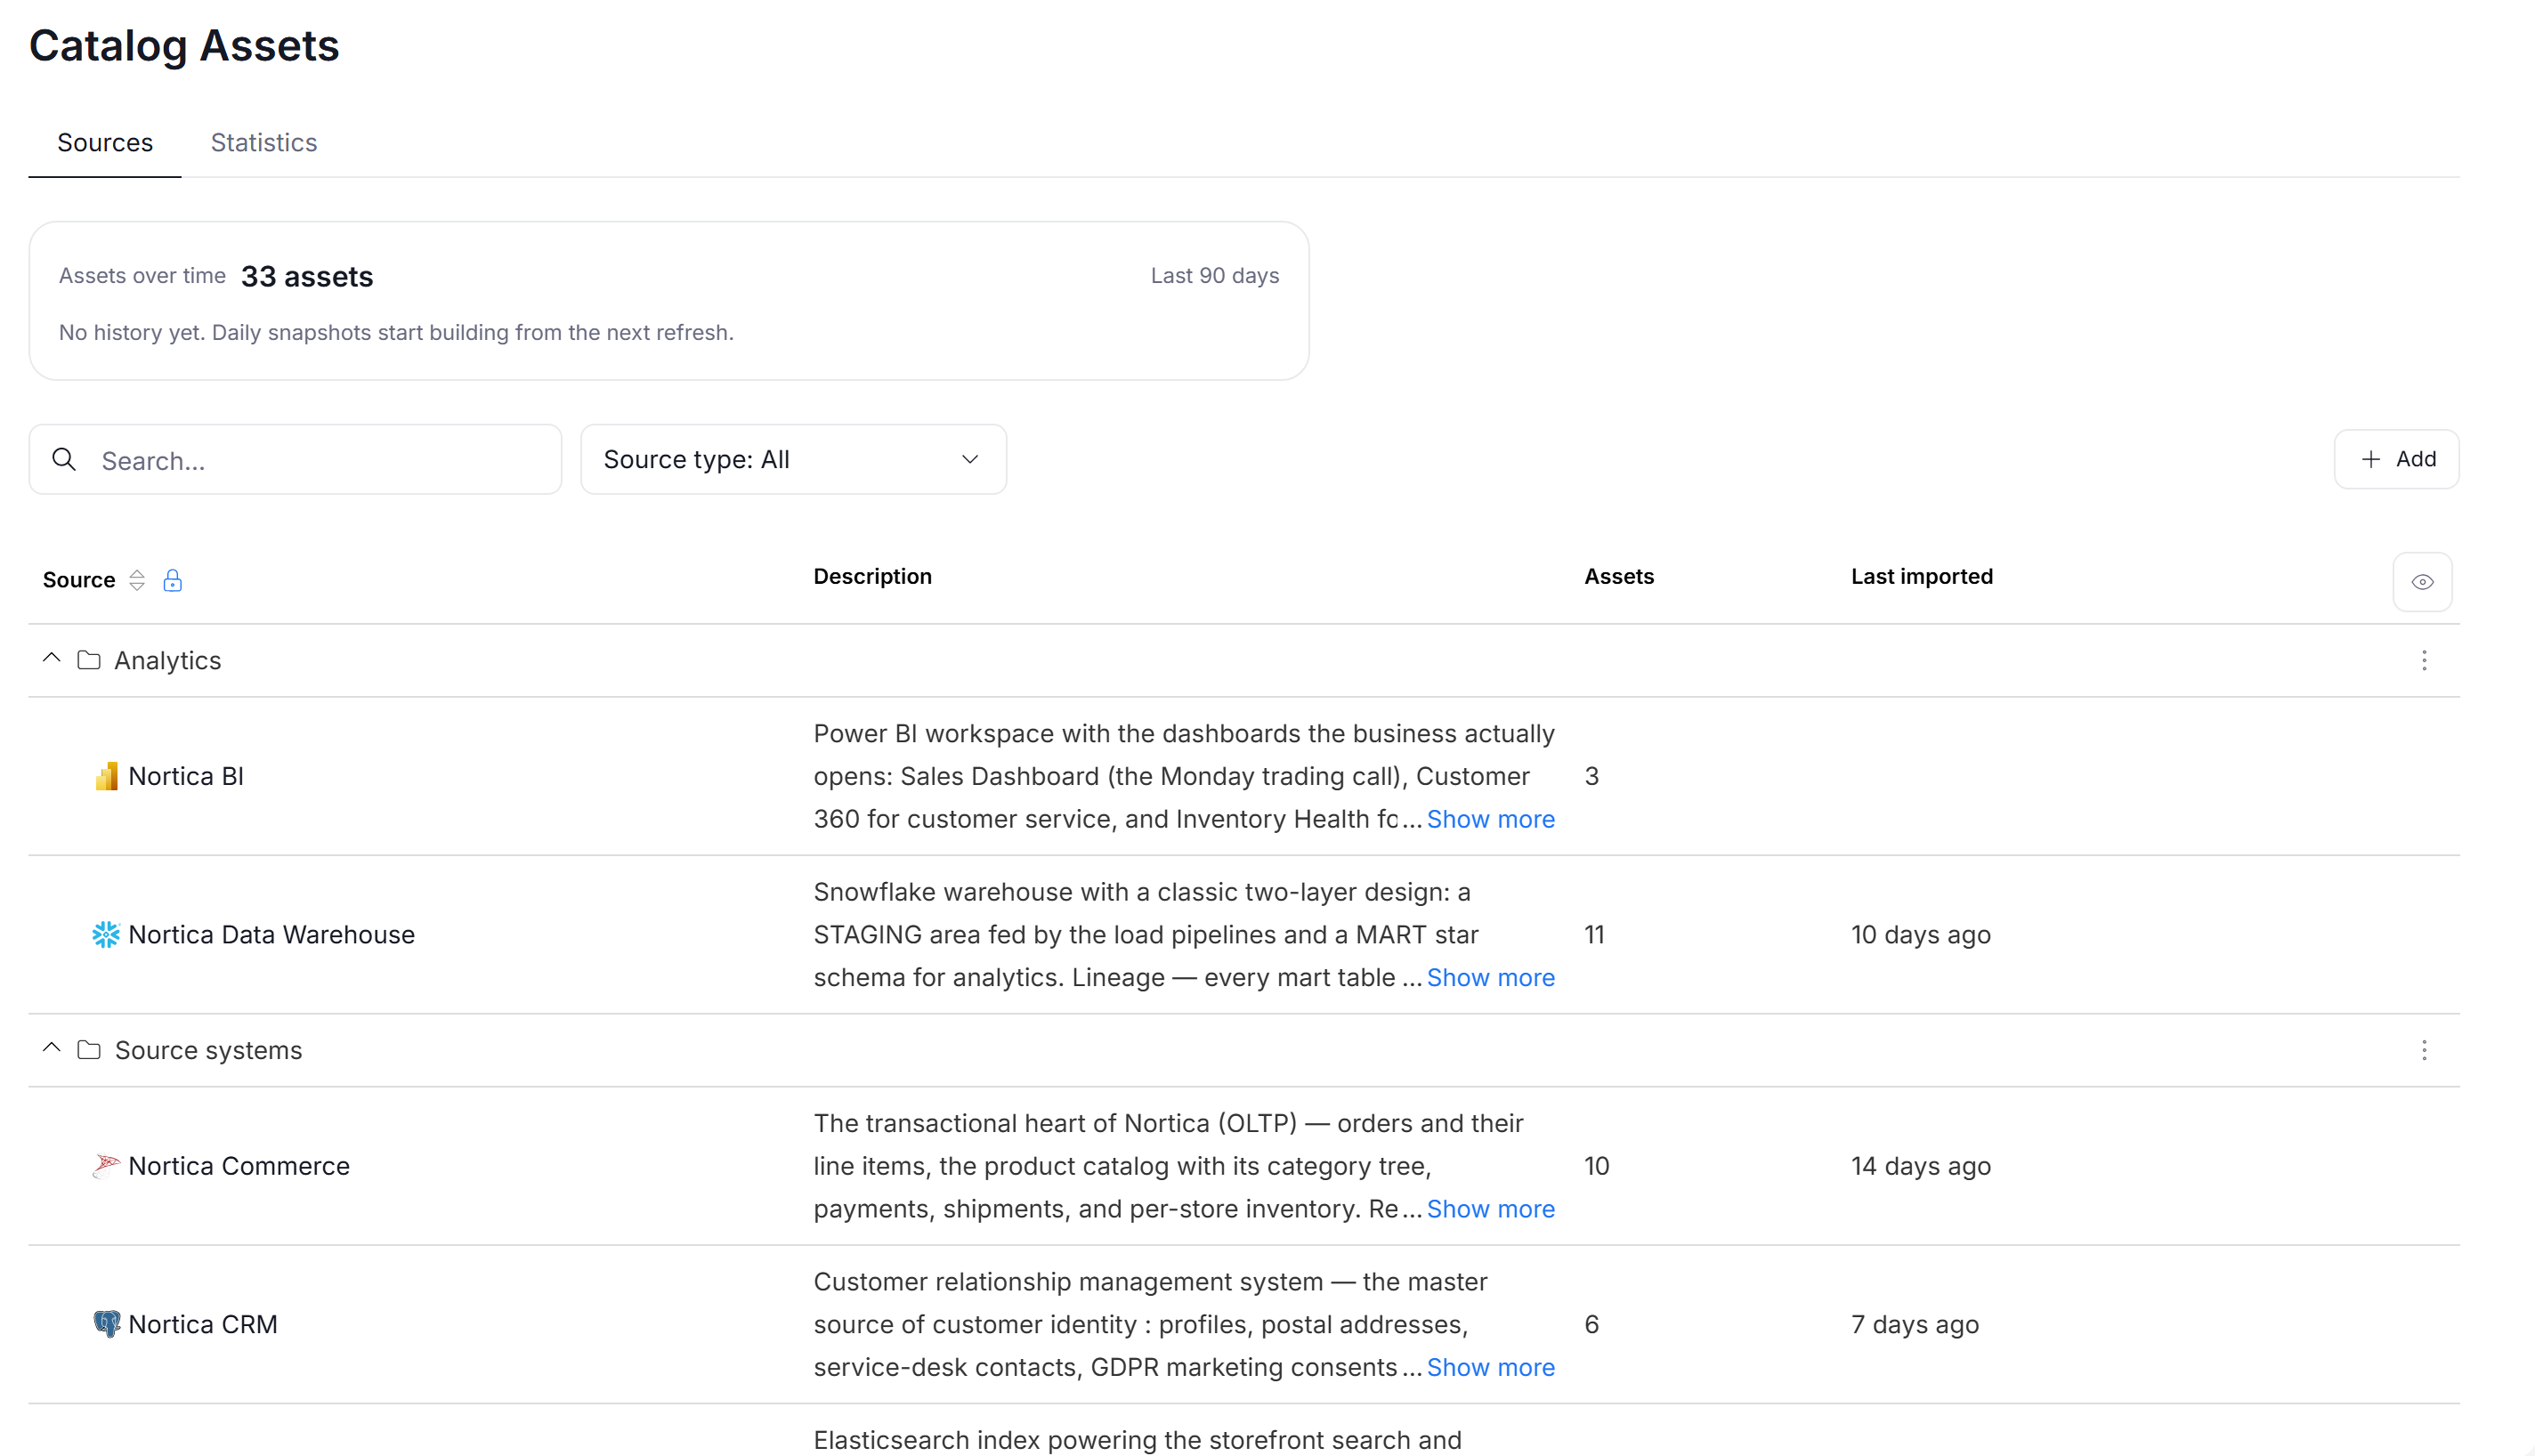
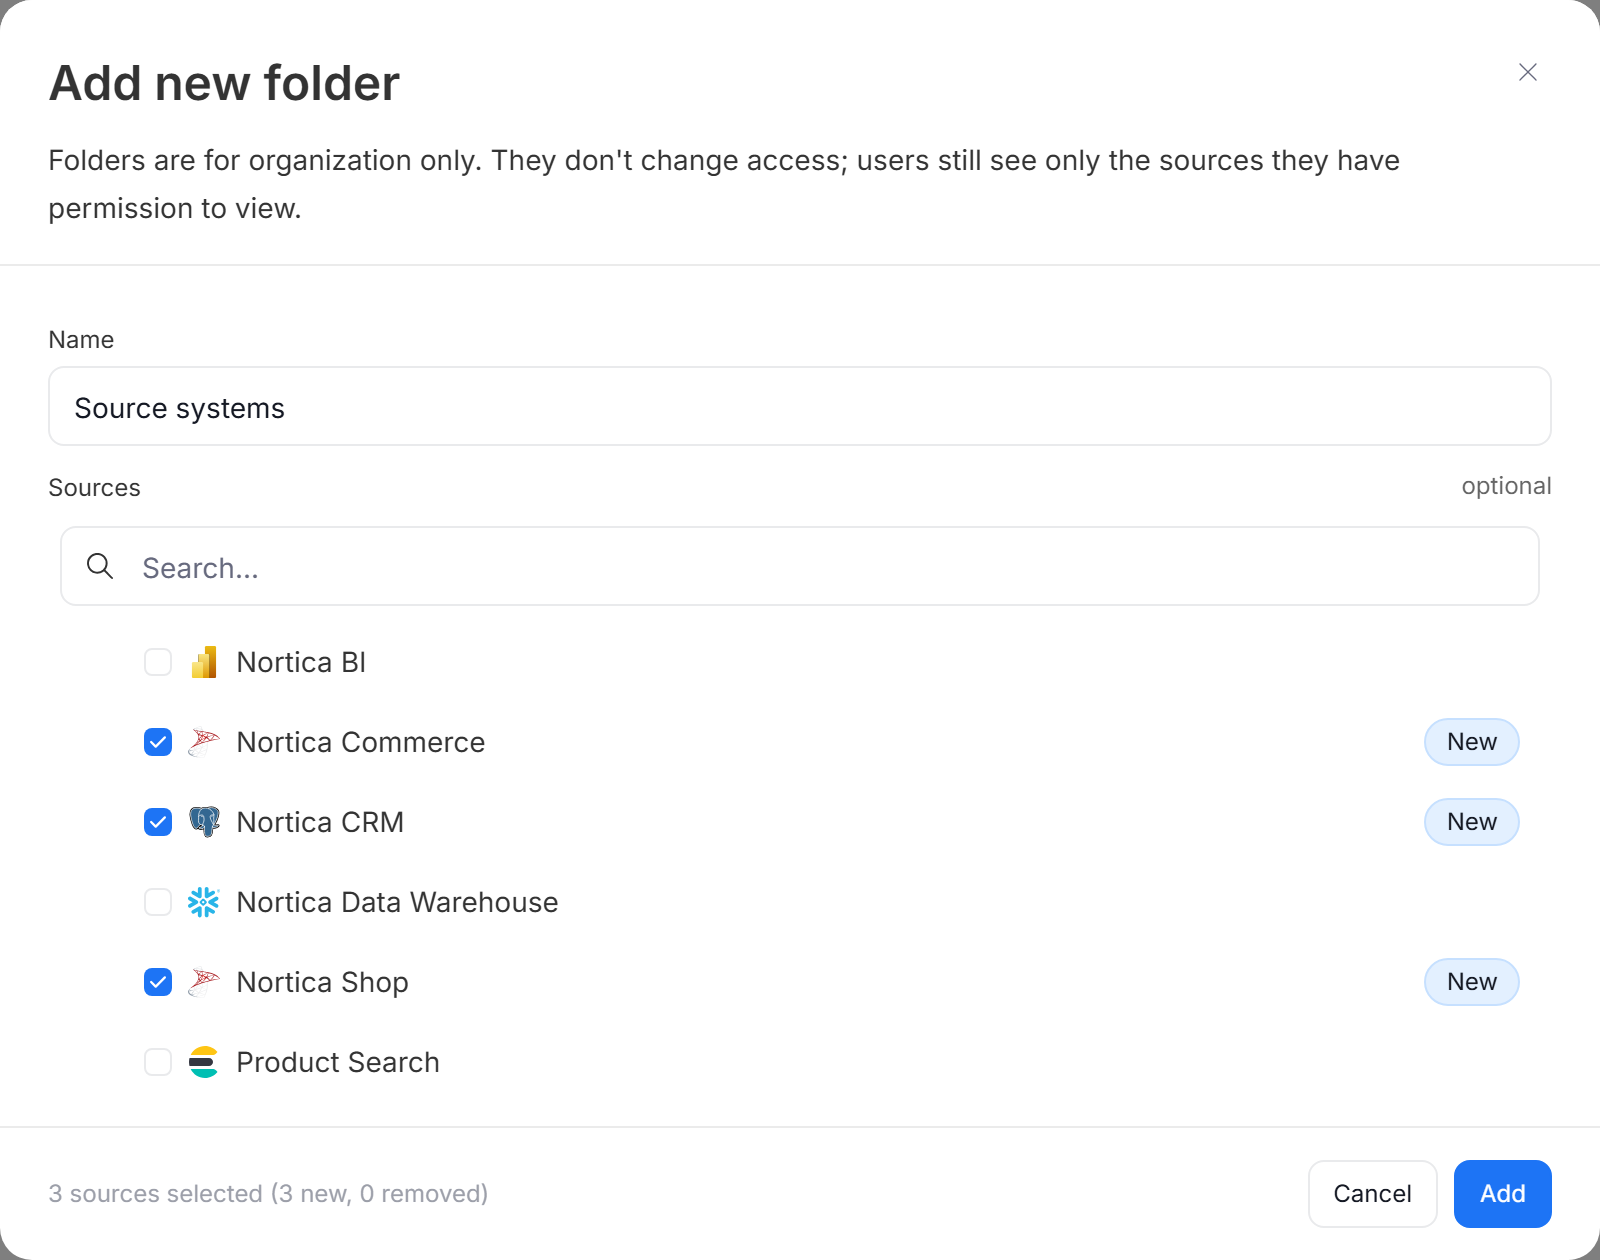
To create a folder, click Add > Folder on the Catalog Assets page (or + > Folder in the sidebar), name it, and select the sources it should contain. A source can belong to one folder at a time. Folders are for organization only — they do not change who can see a source, and deleting a folder does not delete its sources.
Data Lineage improvements
Version 26.4 brings a redesigned Data Lineage diagram and lineage diagrams for Domains, Areas, and Data Products.
Frames on data source, Domain, Area, and Data Product diagrams
Aggregated diagrams — showing a whole data source, Domain, Area, or Data Product — now place all of their objects inside a single frame, marked with the Base tag. Objects that send data into the frame or receive data from it are shown outside of it, on the left and right.
To keep large diagrams readable, the frame first shows only the objects where data enters or leaves the scope. Everything else is collapsed into two sections:
- Pass-through objects — objects that data only passes through, mostly unchanged, on its way into or out of the scope. Data loops often end up here.
- Internal flows — lineage between objects of the scope that never leaves it.
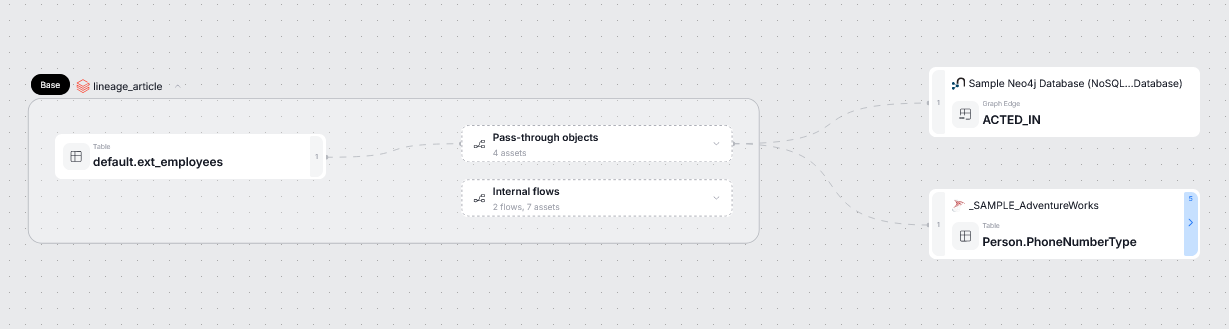
Click a section to expand it in place, and click its header to collapse it again.
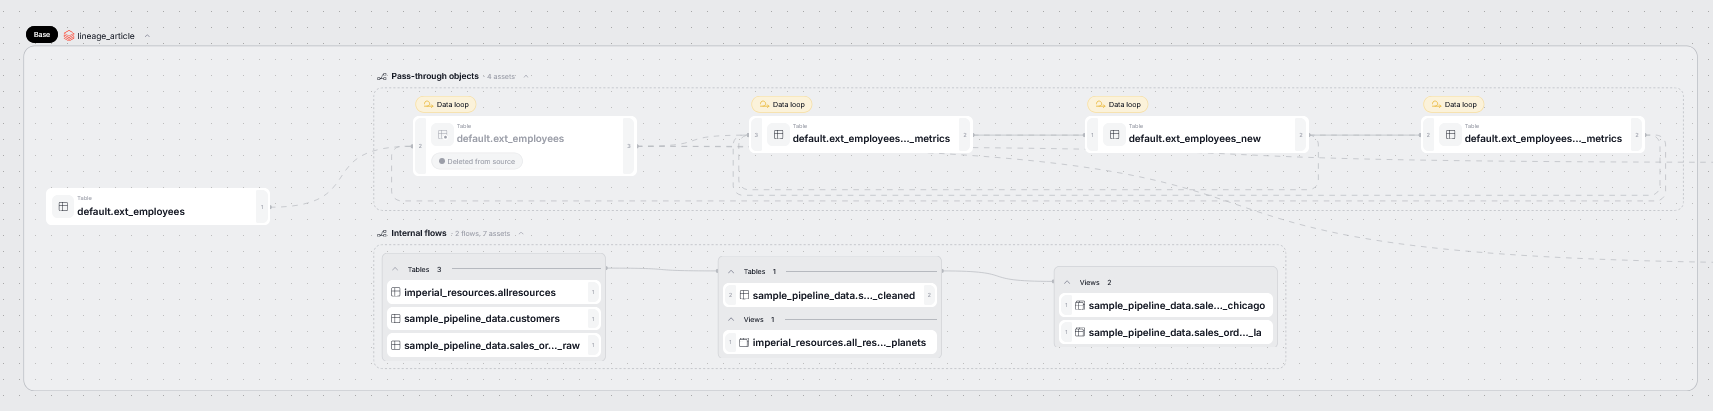
Objects from another scope that data passes through on its way are shown inside the frame, with an Outside this data source tag (or Domain, Area, or Data Product). Objects that are part of a cycle get a Data loop badge — hover over it to see the whole loop.
Lineage for Domains, Areas, and Data Products
Domains, Areas, and Data Products have a new Data lineage tab, showing the lineage of all their linked assets in one frame. Data sources and Data Products linked to the scope appear as separate blocks inside it, which you can collapse into a single card.
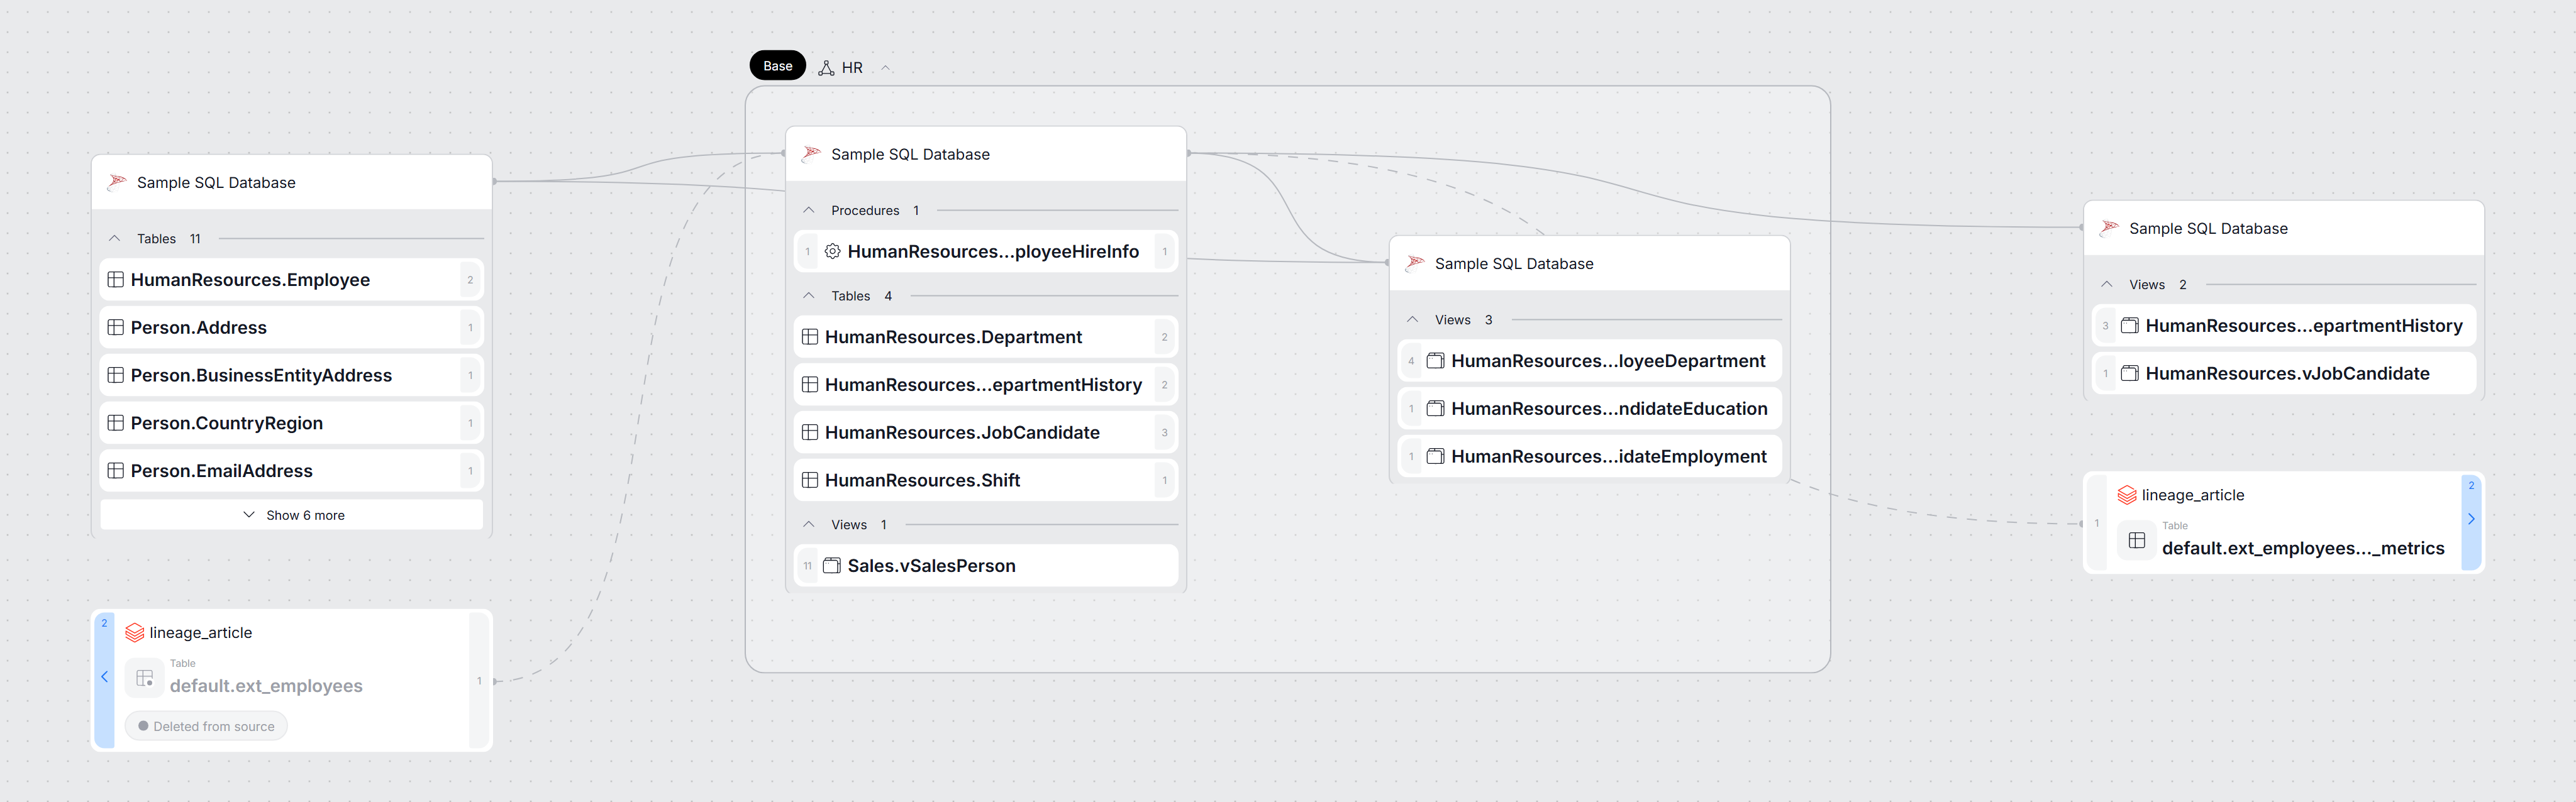
Diagram changes
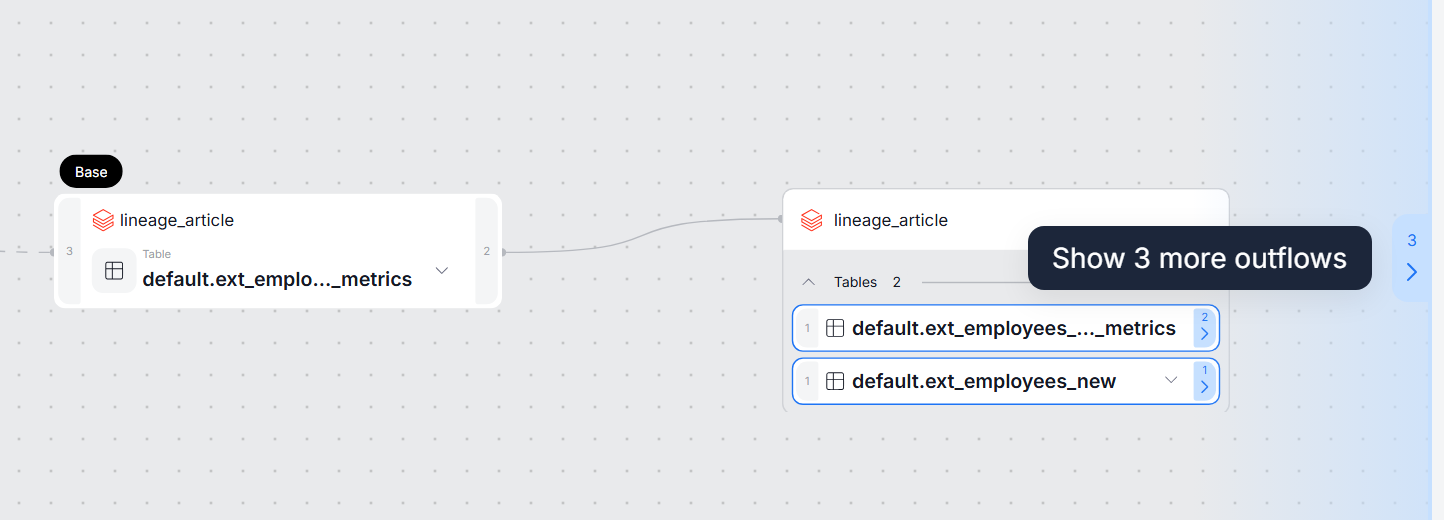
The lineage diagram's UI has also been refreshed. For example, you can now load the next level of inflows or outflows for all objects on the edge of the diagram at once, objects from the same data source on the same level are grouped into a single tile, and counters on the sides of a node show how many objects it connects to.
Data Quality: testing rules before saving
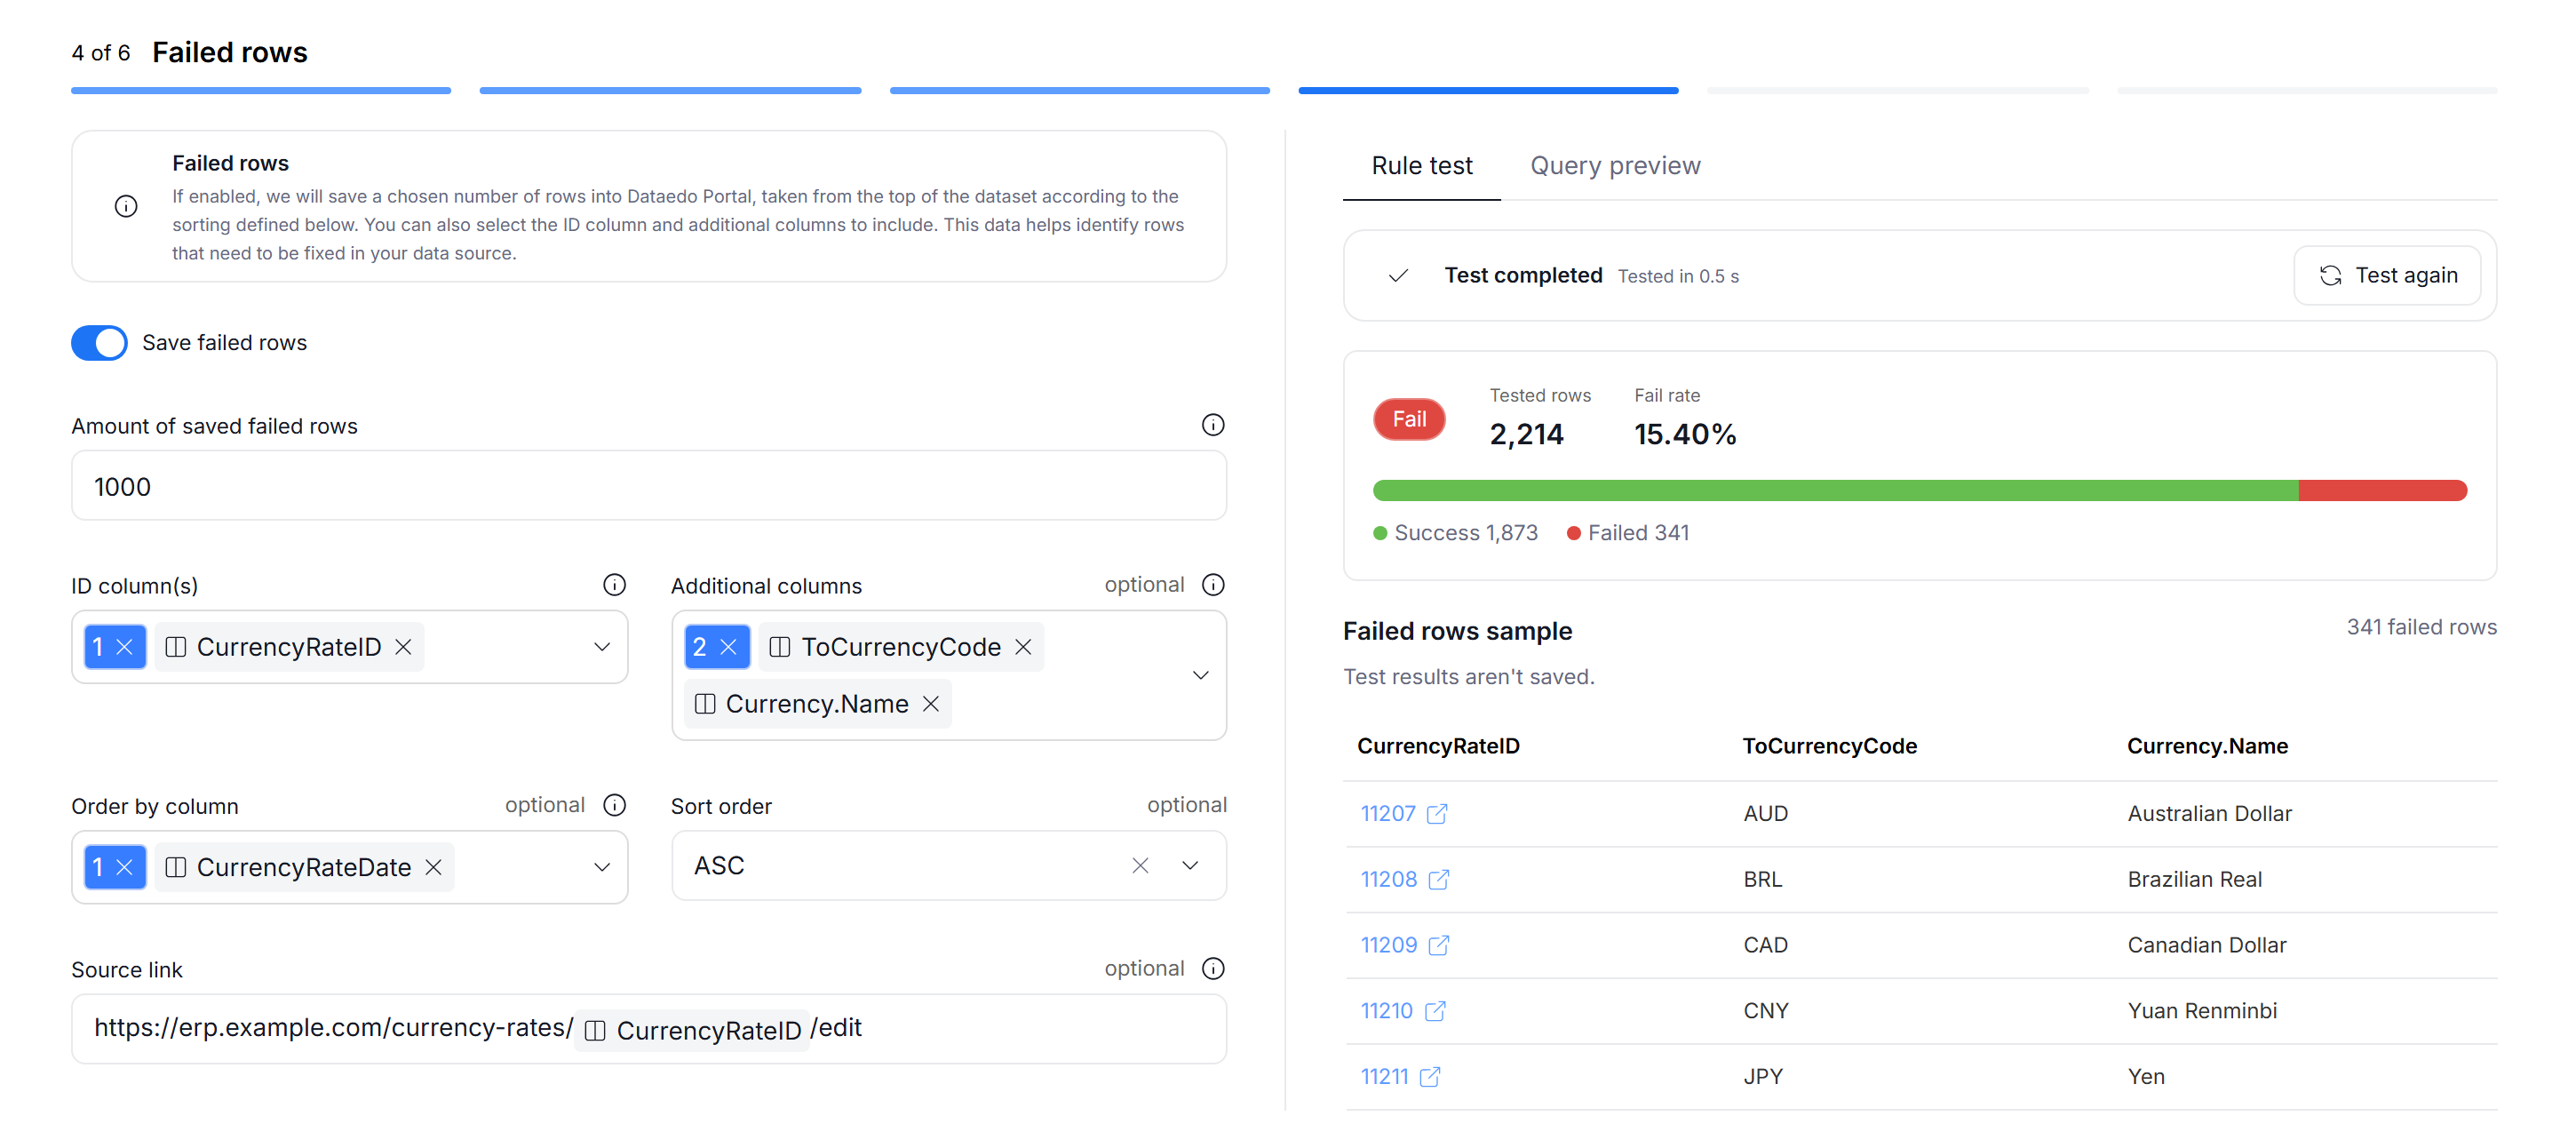
You can now test a Data Quality Rule before you save it. While creating or editing a Rule Instance, click Test rule in the right-hand panel — Dataedo runs the rule on your source through the Agent and shows the number of tested rows, the fail rate, and a sample of failed rows. Nothing is saved, and the test is not added to the run history. If the query fails, you will see the error together with the executed SQL, so you can fix the rule right away.
Failed rows can now also include columns from tables referenced through a foreign key. Select them in Failed rows > Additional columns to see readable values, such as a currency name, next to a failed row's code.
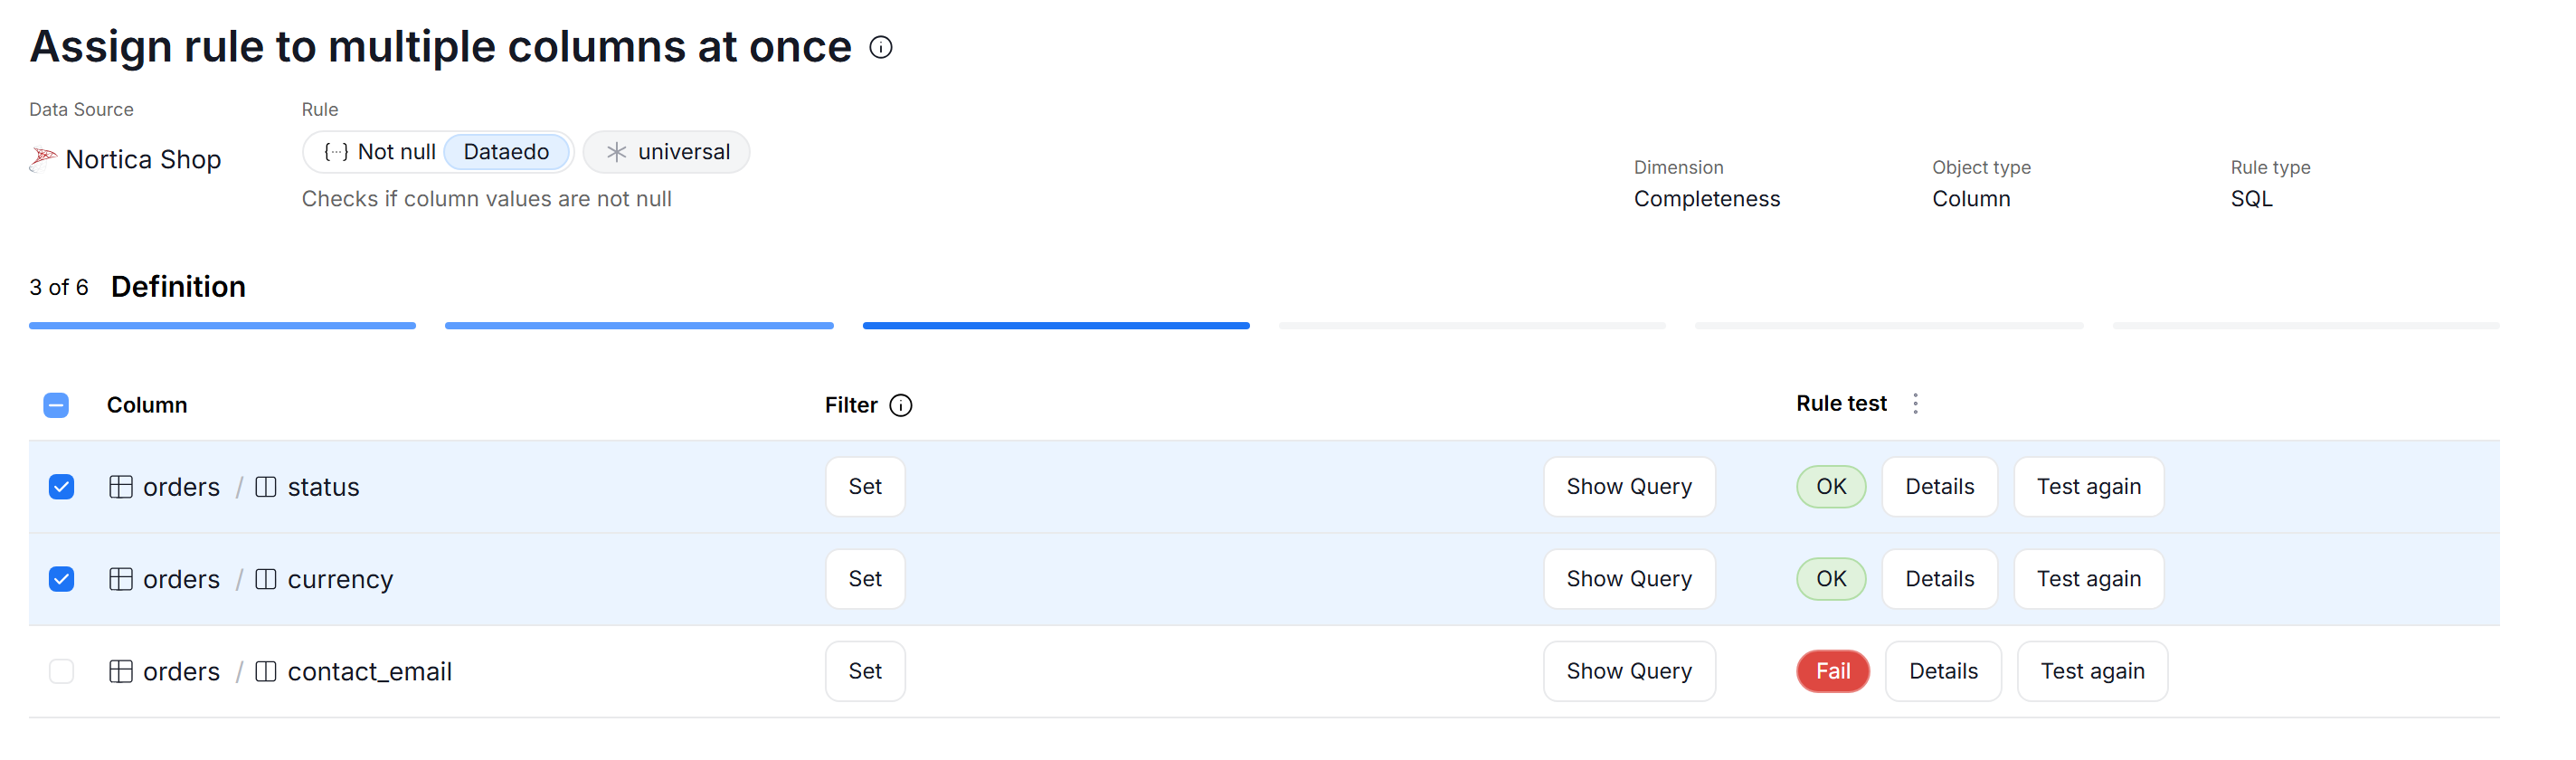
When you assign a rule to multiple columns at once, you can test all or only selected objects from the Rule test column.
Testing runs queries on your data source, which may affect performance or cost if using pay-per-query sources. To mitigate that, you can optionally limit testing to Connection Managers only in Settings > System settings > General, in the Data access section.

ERD improvements
The Diagram tab is now called Relationships and combines the ERD diagram with a Relationships panel listing all relationships shown on it. The panel narrows down to the highlighted object, and users with edit permissions can edit relationships or test the selected ones directly from it.
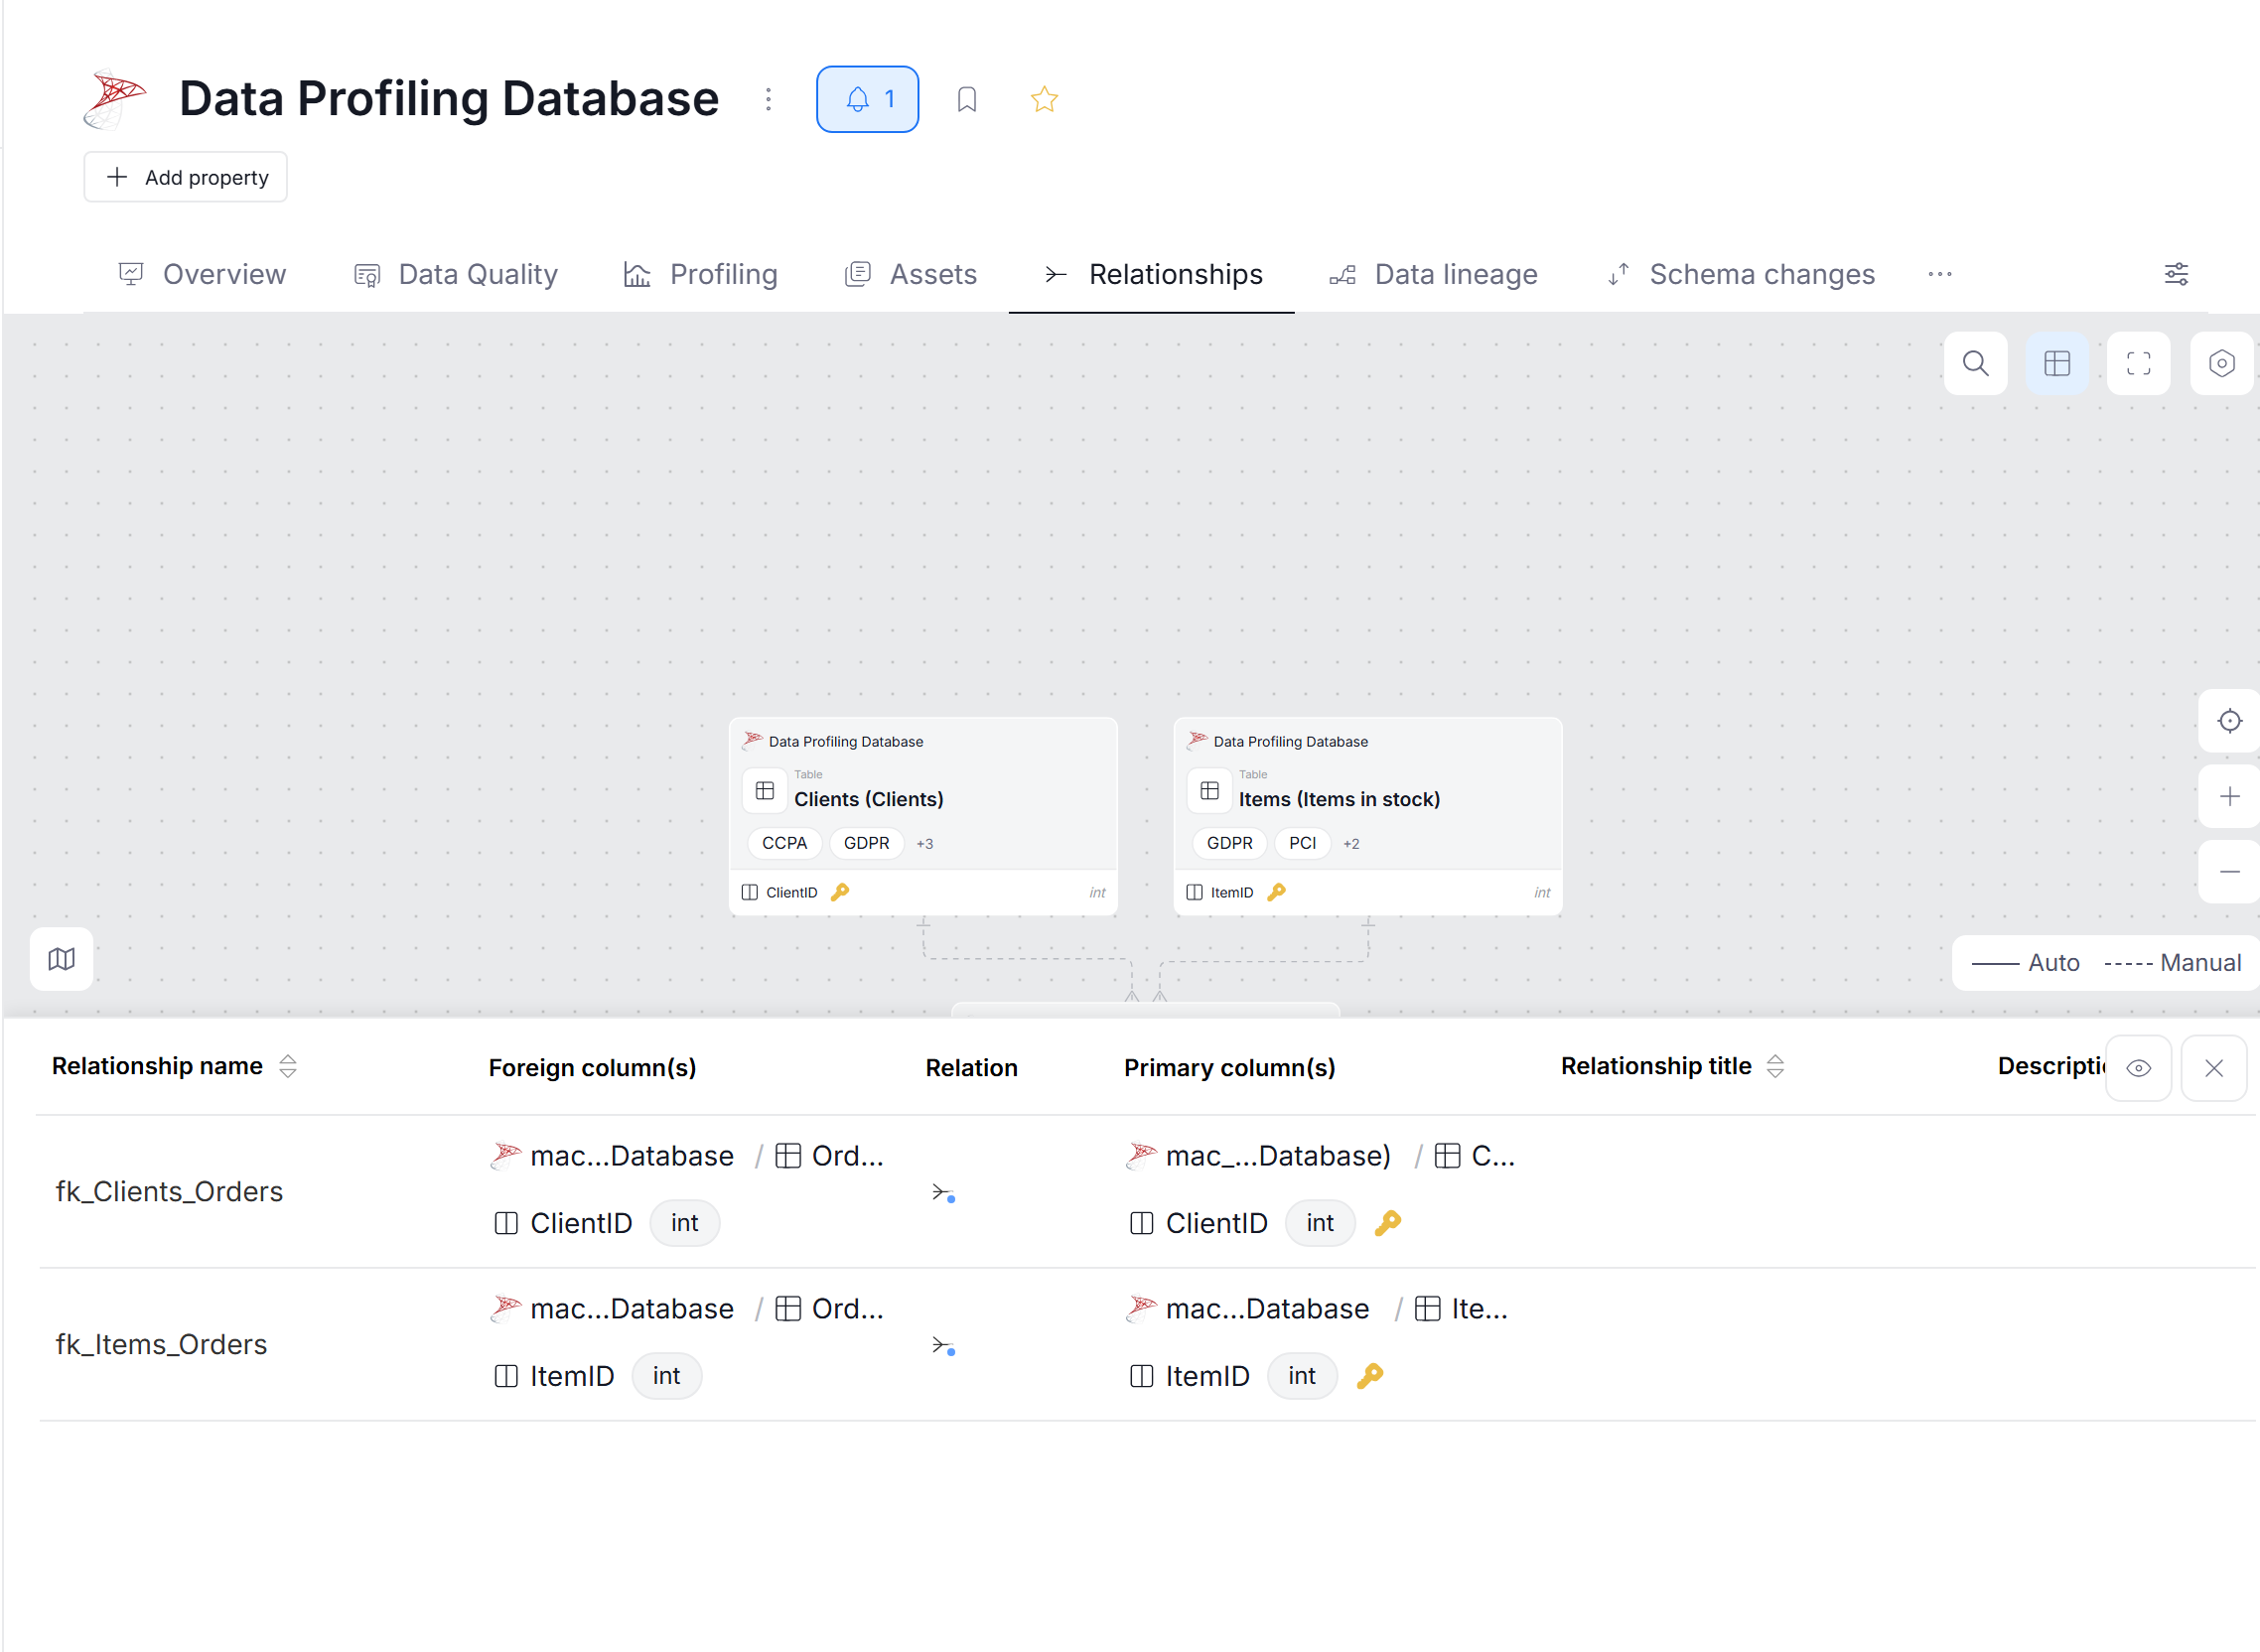
Editable diagrams are now available for Domains, Data Products, and data sources, in addition to Areas. Learn more here.
Multiple AI providers
AI Autodocumentation is no longer limited to a single provider. Admins can now add multiple AI engines in System Settings.
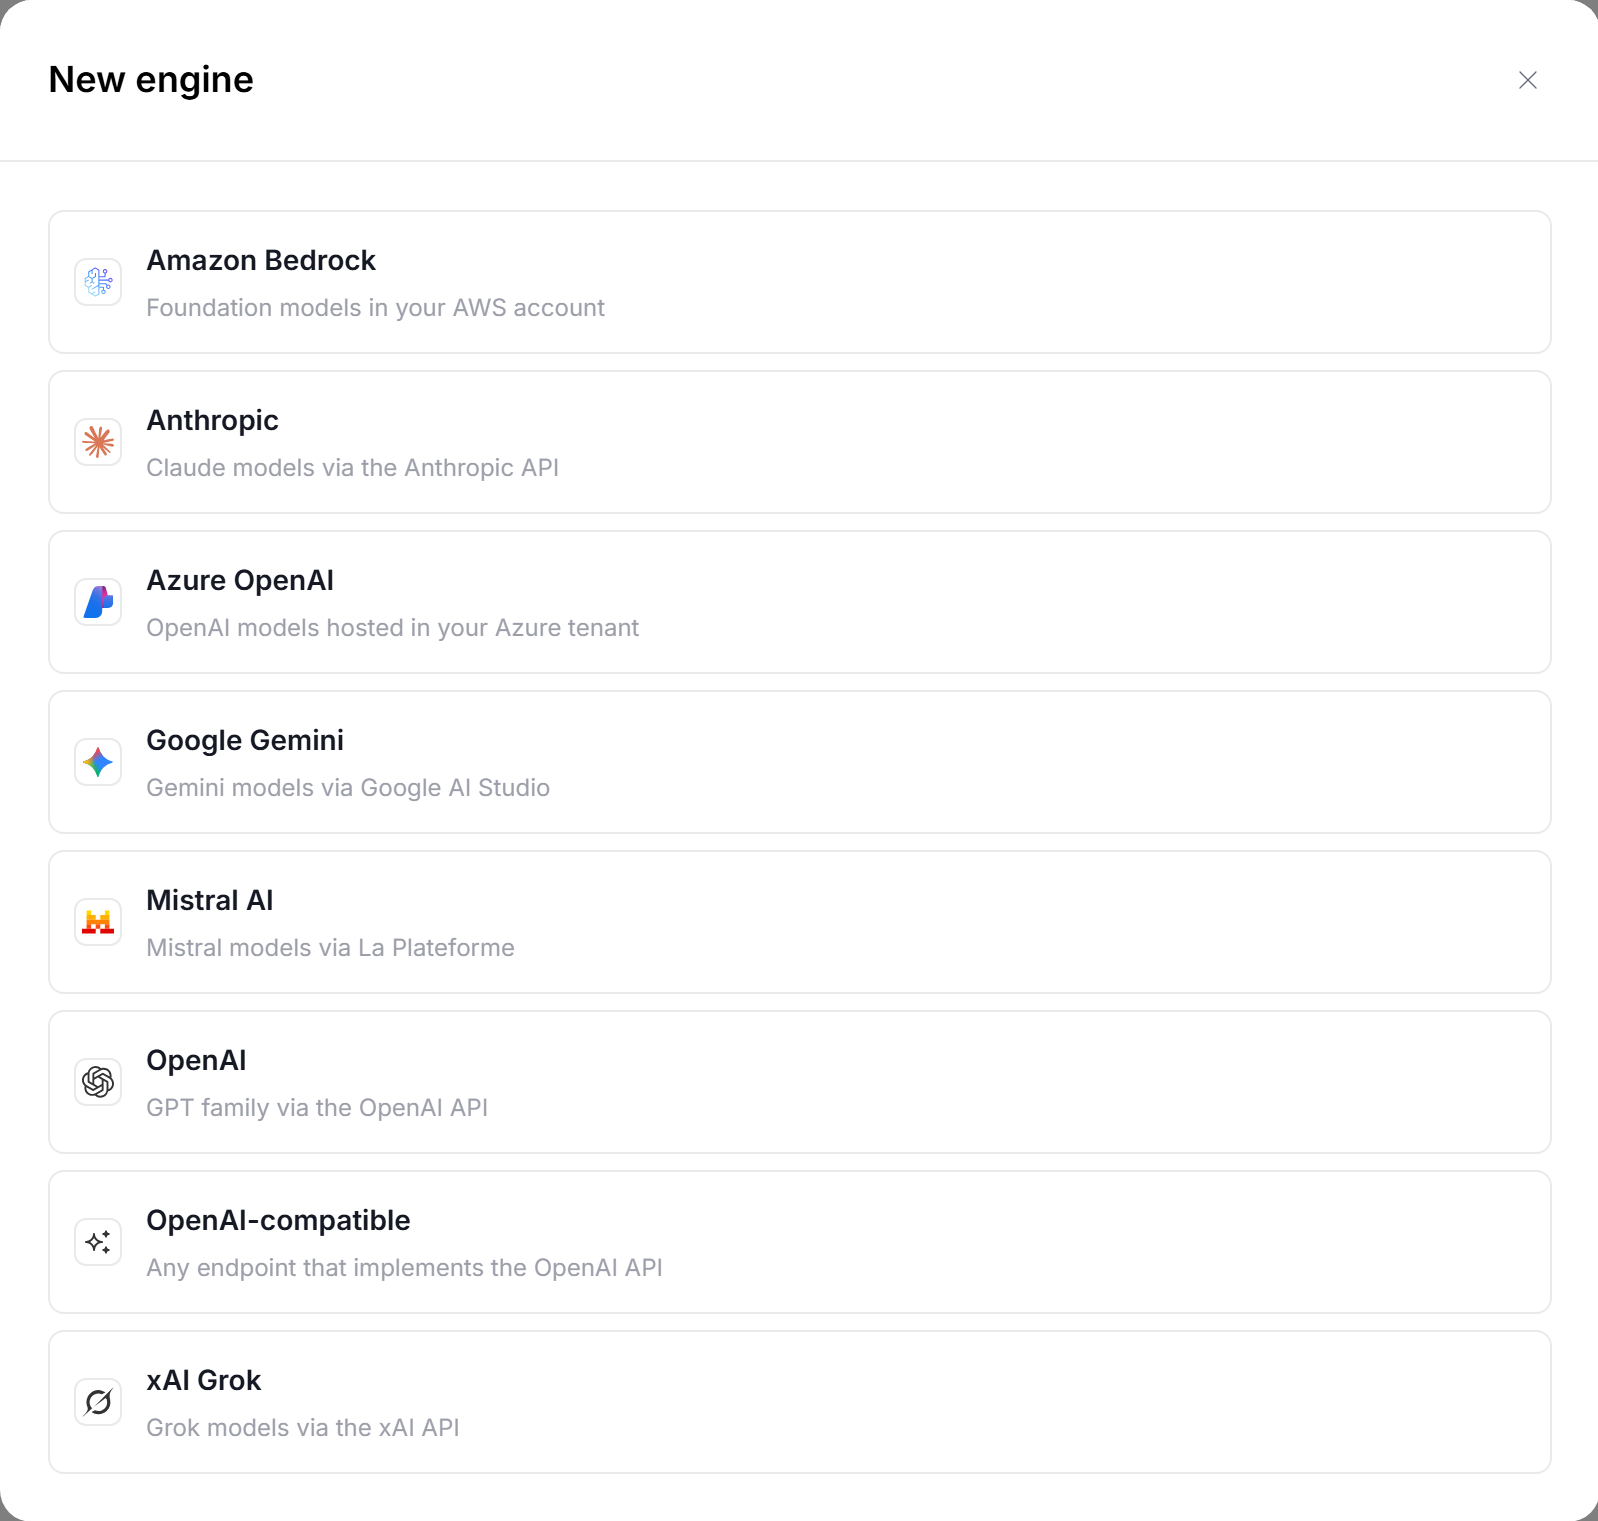
You can configure several engines — for example a cheaper one for column descriptions and a stronger one for Glossary terms — and pick one each time you generate descriptions. Learn more here.
Connector improvements
Power BI
The Power BI connector now imports Microsoft Fabric Dataflow Gen2. Reading Gen2 dataflows is possible thanks to the new built-in Power Query (M) parser.
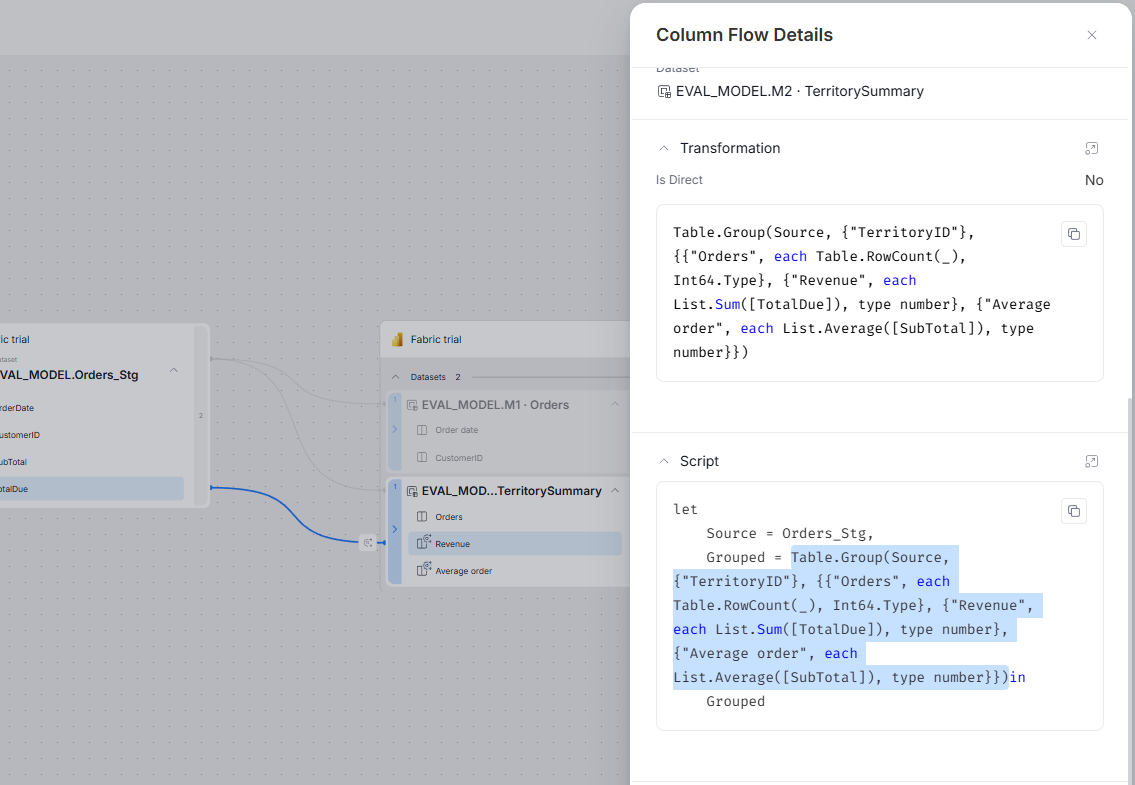
The changes result in lineage generated for Power BI sources being stronger.
Since tables and fields are now matched more strictly, some incorrect flows created by earlier versions may disappear after the first import
Other changes
Scheduler improvements
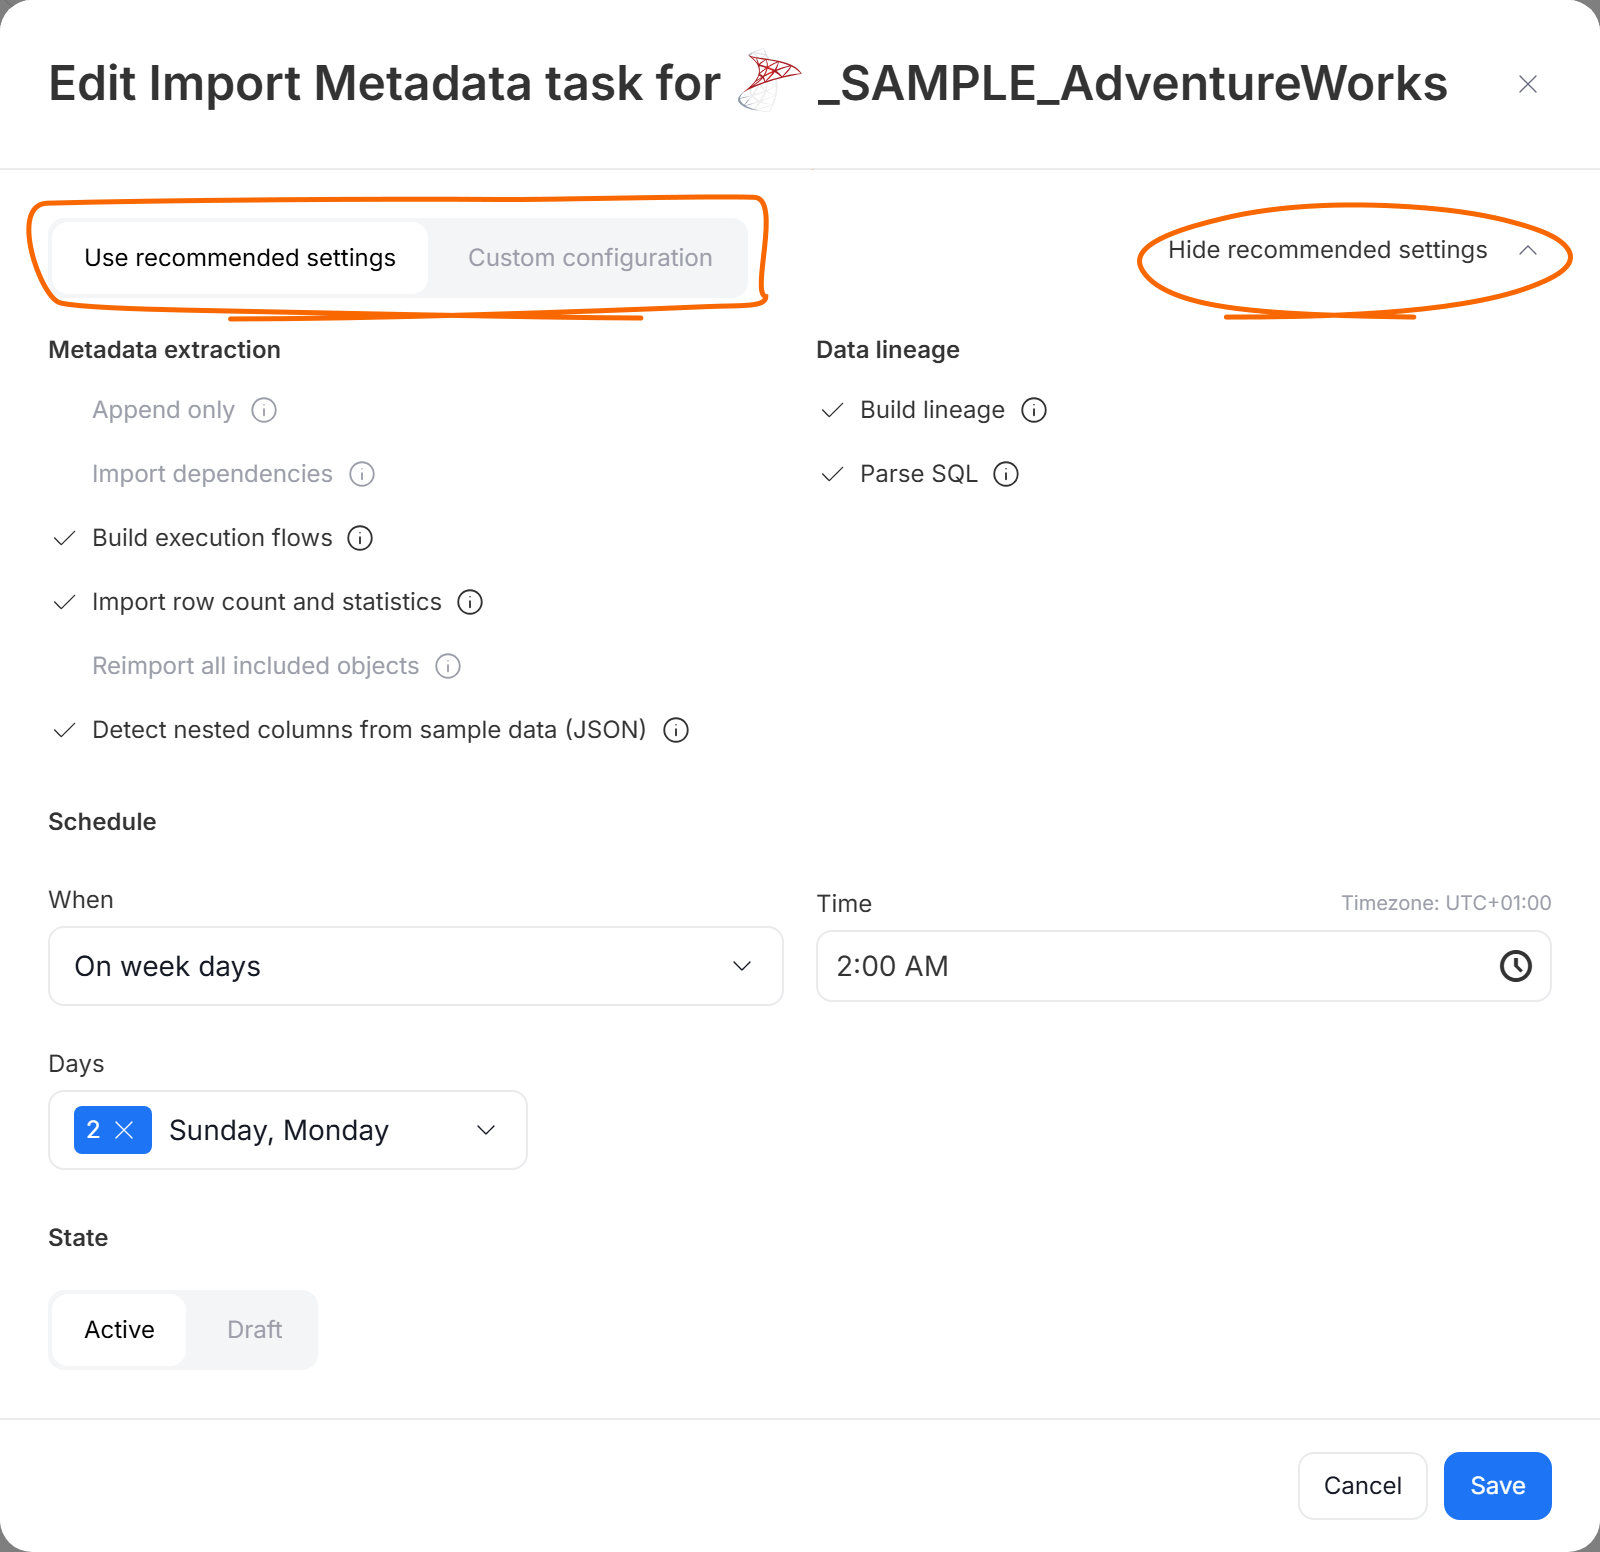
When you add a new data source, the Schedule step now comes pre-filled with default tasks: a weekly Metadata Import, which also runs right away, and a monthly Data Profiling run, where supported. You can edit or remove them before saving.
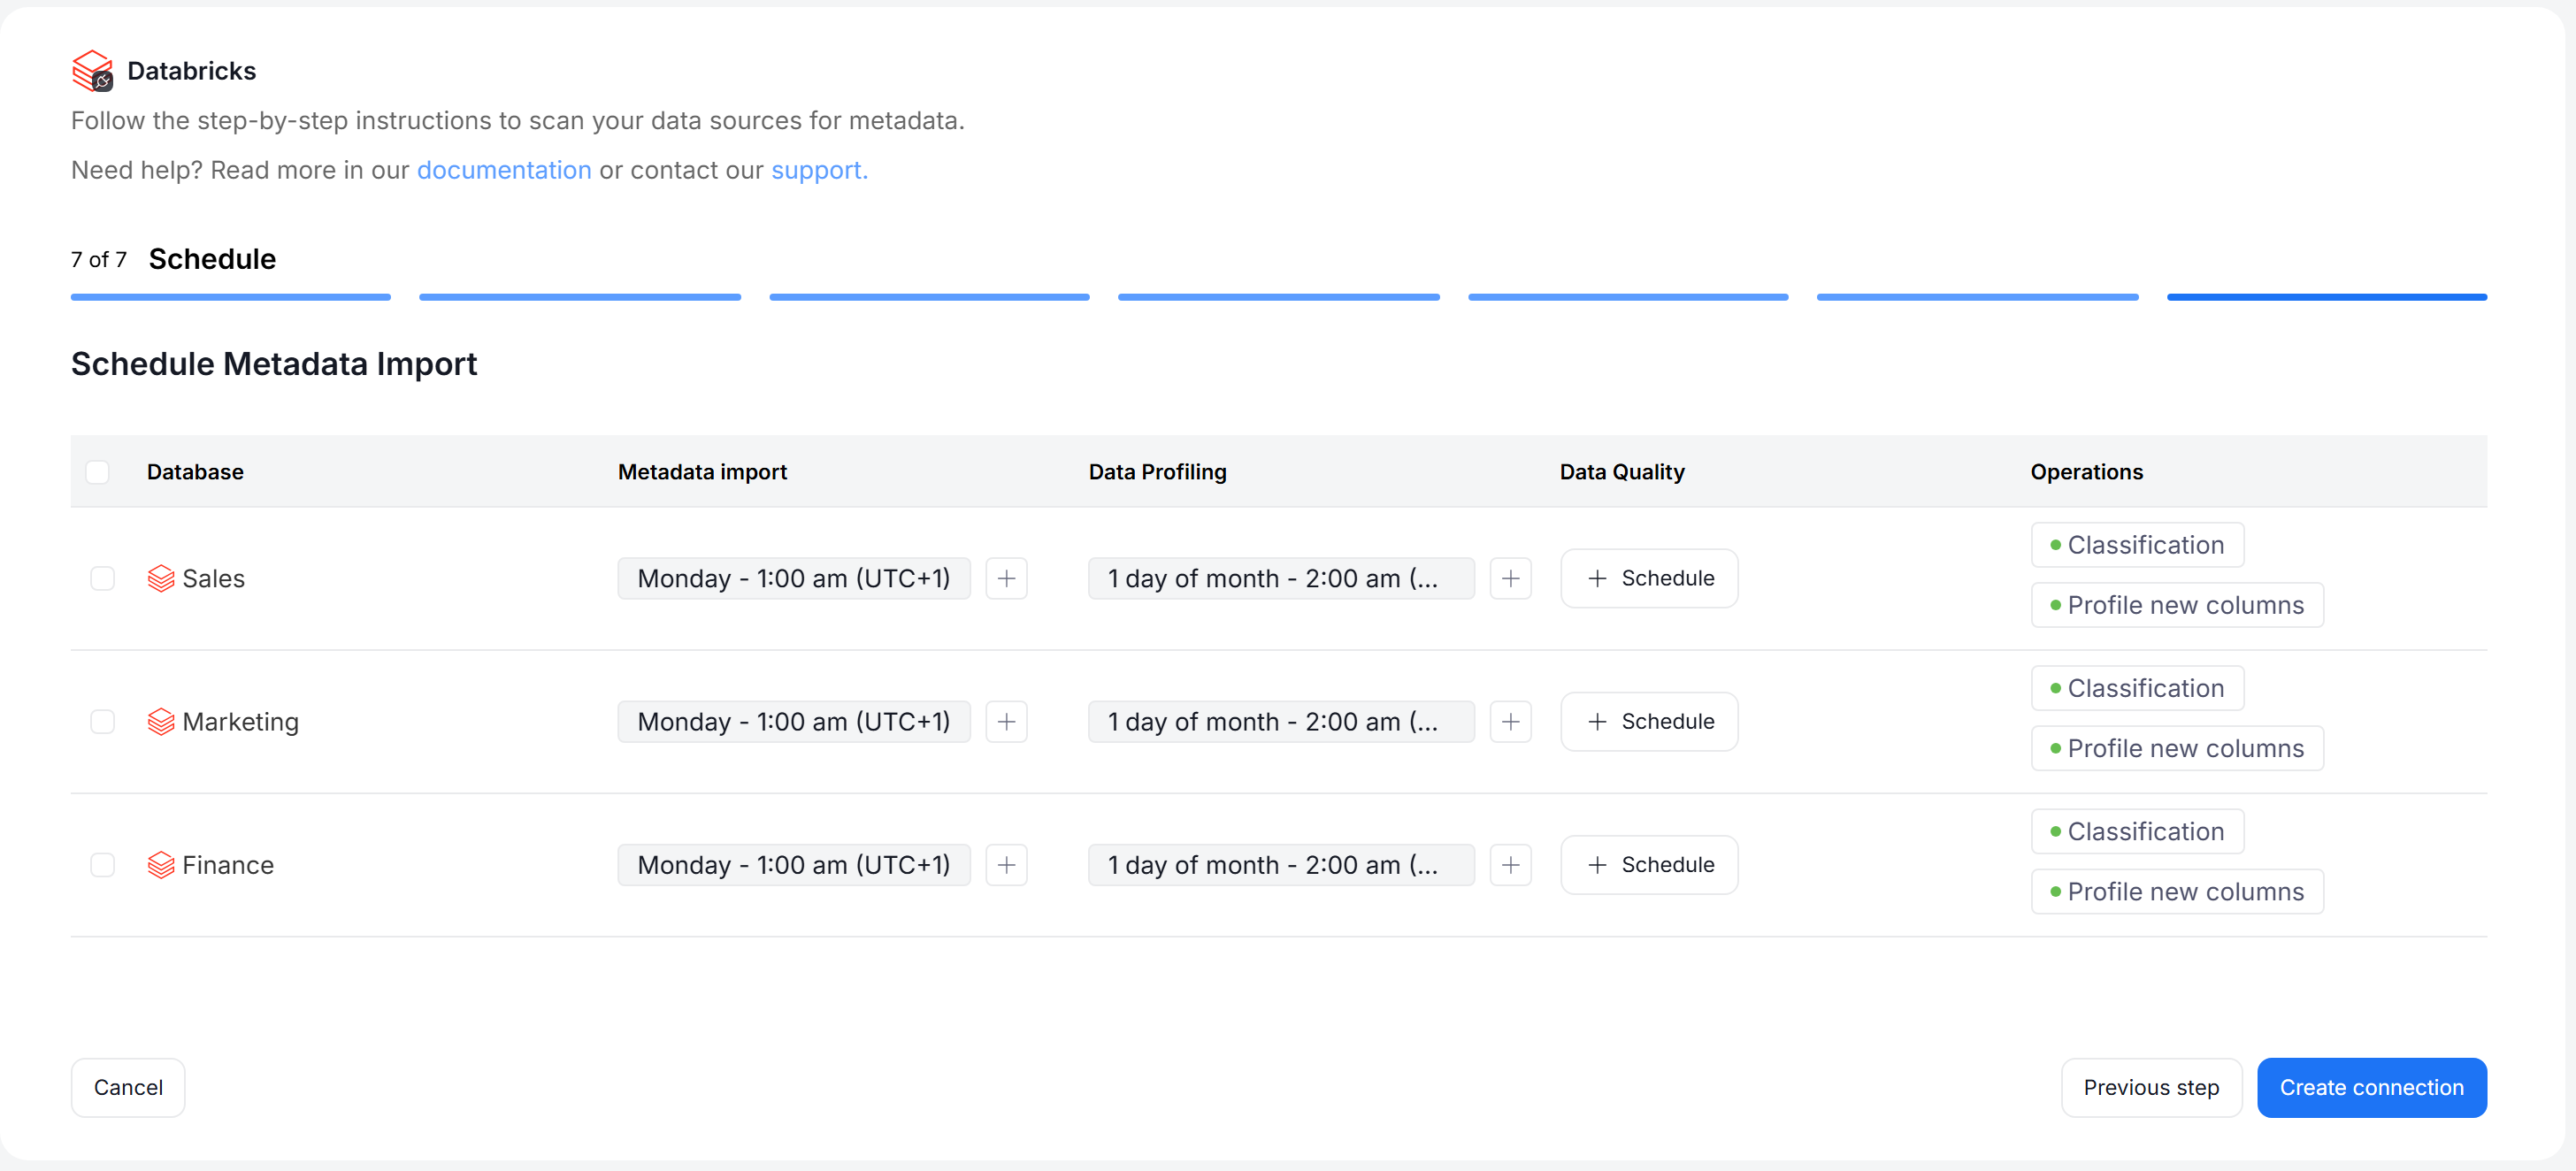
Metadata Import tasks now have a Use recommended settings mode, which applies the import options we recommend for the connector. Switch to Custom configuration to set them yourself.
We also added a permission for Connection Managers to manually rearrange tasks waiting in the execution queue. Learn more here.
Login method binding
Each Dataedo account is now bound to a single login method. This means that every user can log in using only one authentication method. Users are bound to that method automatically upon their first sign-in, or assigned manually by an Admin during account creation.
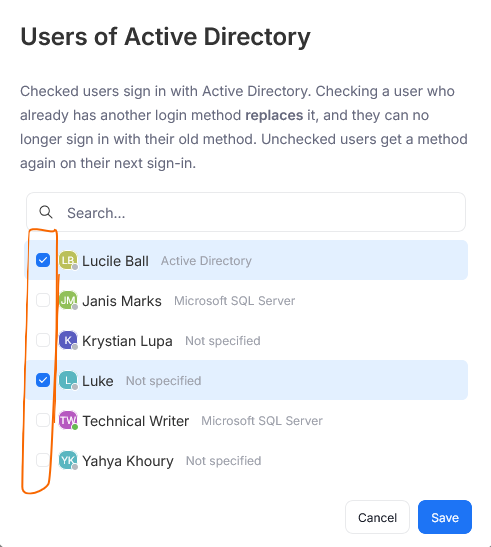
You can still have multiple authentication methods configured in your repository, since different users might prefer to log in using different methods.
SAML Single Logout
The Dataedo SAML login option can now offer Single Logout. When enabled, logging out of Dataedo Portal also ends the session at your identity provider. This makes it so during the next sign-in the user will be asked to log in manually. This setting is especially useful in environments where your users share workstations.
Single Logout is turned off by default and has to be configured manually for each authentication method. Read our article on SAML Single Logout for setup details.
Data sources and reporting instances grouped into one section
Version 26.4 introduces a small grouping change to the imported metadata. Both reporting instances and data sources are now grouped together into an Assets section, available from the Catalog section in the navigation sidebar.
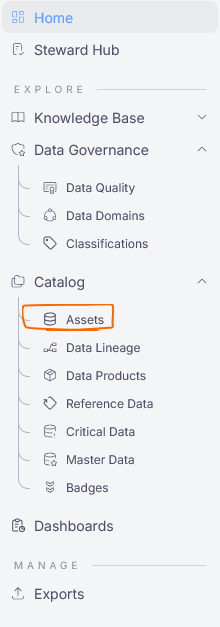
This change is conceptual in nature — reports and data sources are quite similar to each other, and the border between the two is not always clear — for example, some people might see Power BI datasets as data sources, while others see them as reports. Grouping all imported metadata into one section helps avoid any uncertainty caused by this ambiguity.
Dashboard improvements
We moved some of the dashboards displayed in Dataedo over to our native widget components. This change mostly affects the speed at which widgets get updated, and helps unify the visuals throughout Dataedo Portal.
PK/FK tester improvements
The PK/FK testing pop-up received a UI update. The result summary now appears in the bottom section. When you test multiple relationships at once, progress and results are shown only in the results window, with no extra pop-up notifications.
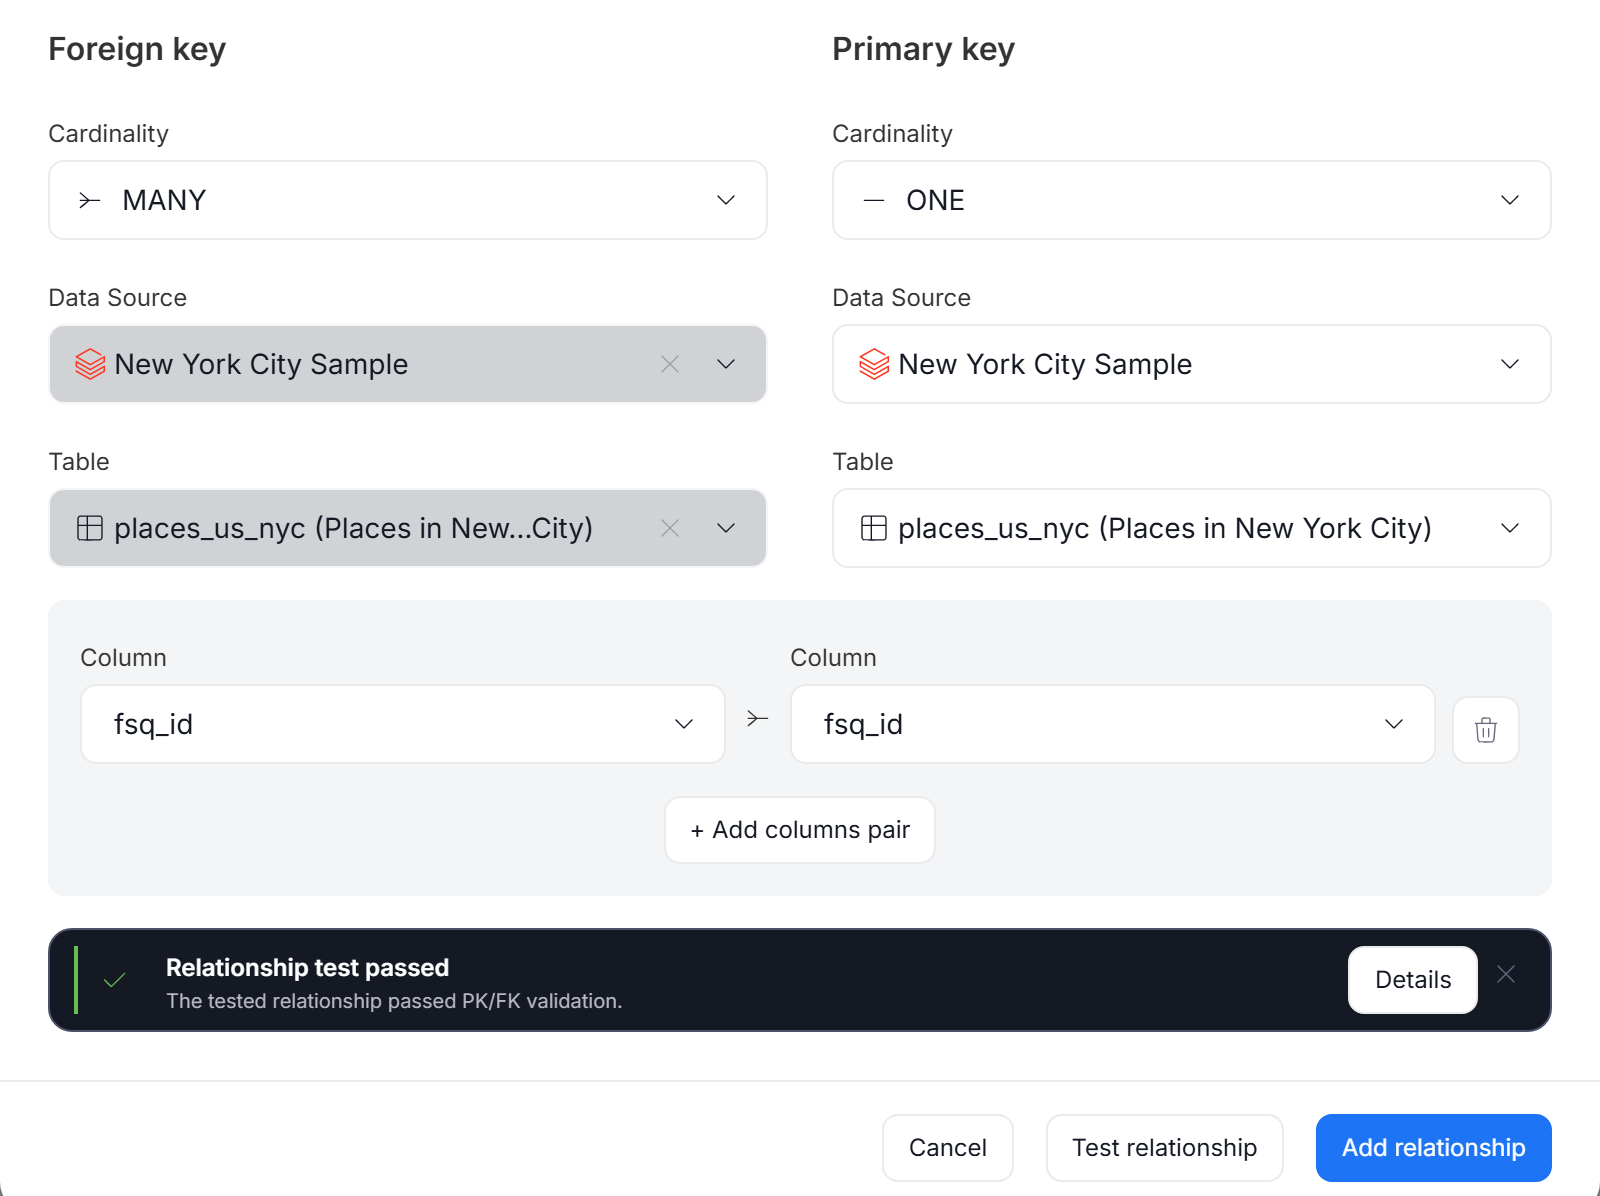
These changes make the tester results more readable on small screens.
Searchable users
From this version on, Dataedo search can also find users in your repository. Previously, it worked only on assets.
SMTP can be turned off
Previously, once you configured an SMTP server for email notifications and access code login, you could no longer turn it off. In short, SMTP details could be changed, but never fully disabled. Dataedo 26.4 lets you turn off SMTP by clearing all the data configured in Settings > System Settings > Email.
Import Summary
The Import Summary now helps you find out what went wrong with an import. Each section of the import has its own status (for example Partially imported, Failed, or Skipped), and problems are explained in cards that describe what happened and what to check.
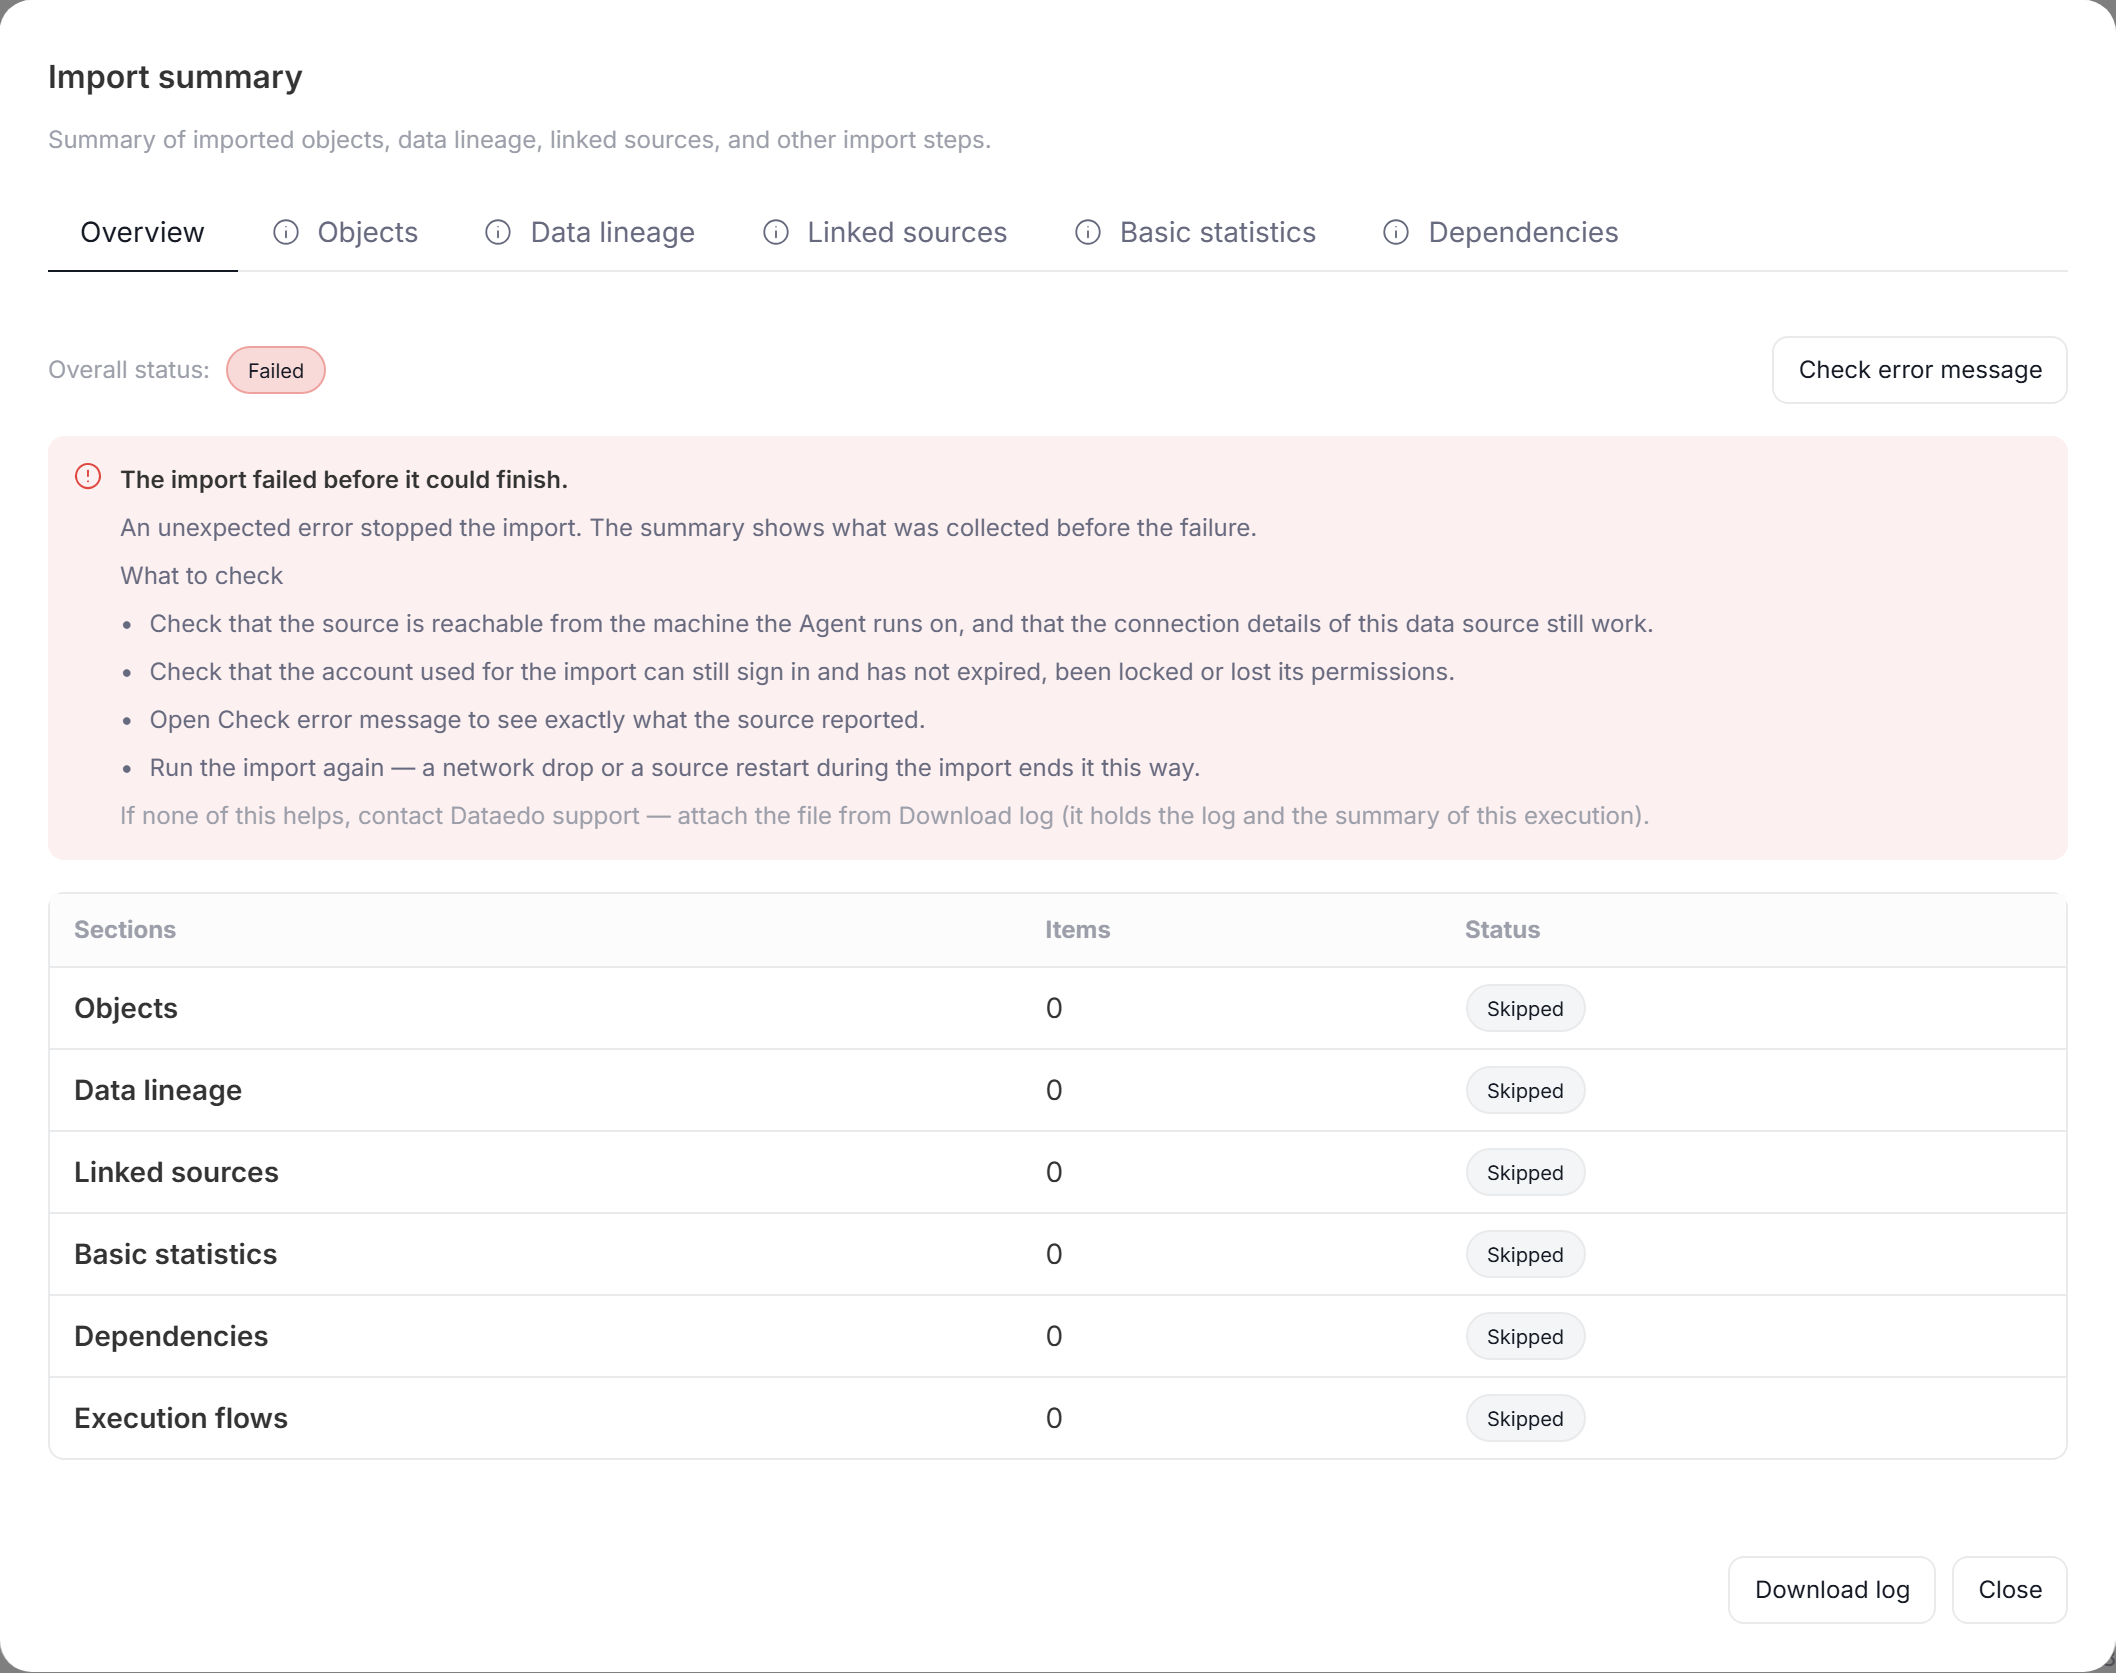
Download log now produces a single file with both the execution log and the summary — attach it when contacting our support. The detailed summary is available for SQL Server, Azure SQL Database, Oracle, PostgreSQL, MySQL, Snowflake, Databricks, Amazon Redshift, SAP HANA, and Power BI. Learn more here.
Import log
Metadata imports now leave an import log. When running imports by hand, you can choose a Log level — Debug, Information, Warning, or Error — depending on the depth of information you need. Logs can be used for debugging, or sent to our support when looking for help with import issues. Learn more here.
Deeper Domain nesting
Domains can now be nested one level deeper — up to five levels, a Domain with four levels of Areas. Learn more here.
UI & UX changes
Shortening long names in the middle
Long object names are now shortened in the middle instead of at the end. This way you can tell apart names with a common prefix, such as customer_address_line_1 and customer_address_line_2.
Clickable badges
Clicking a badge on an object now opens the list of all objects with that badge. The list is already filtered by the badge you clicked.
History of changes
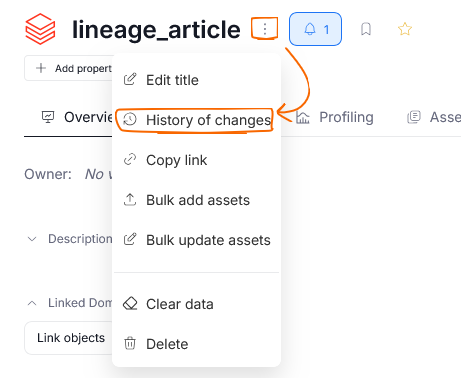
History of changes now shows all changes to an object in one chronological feed.
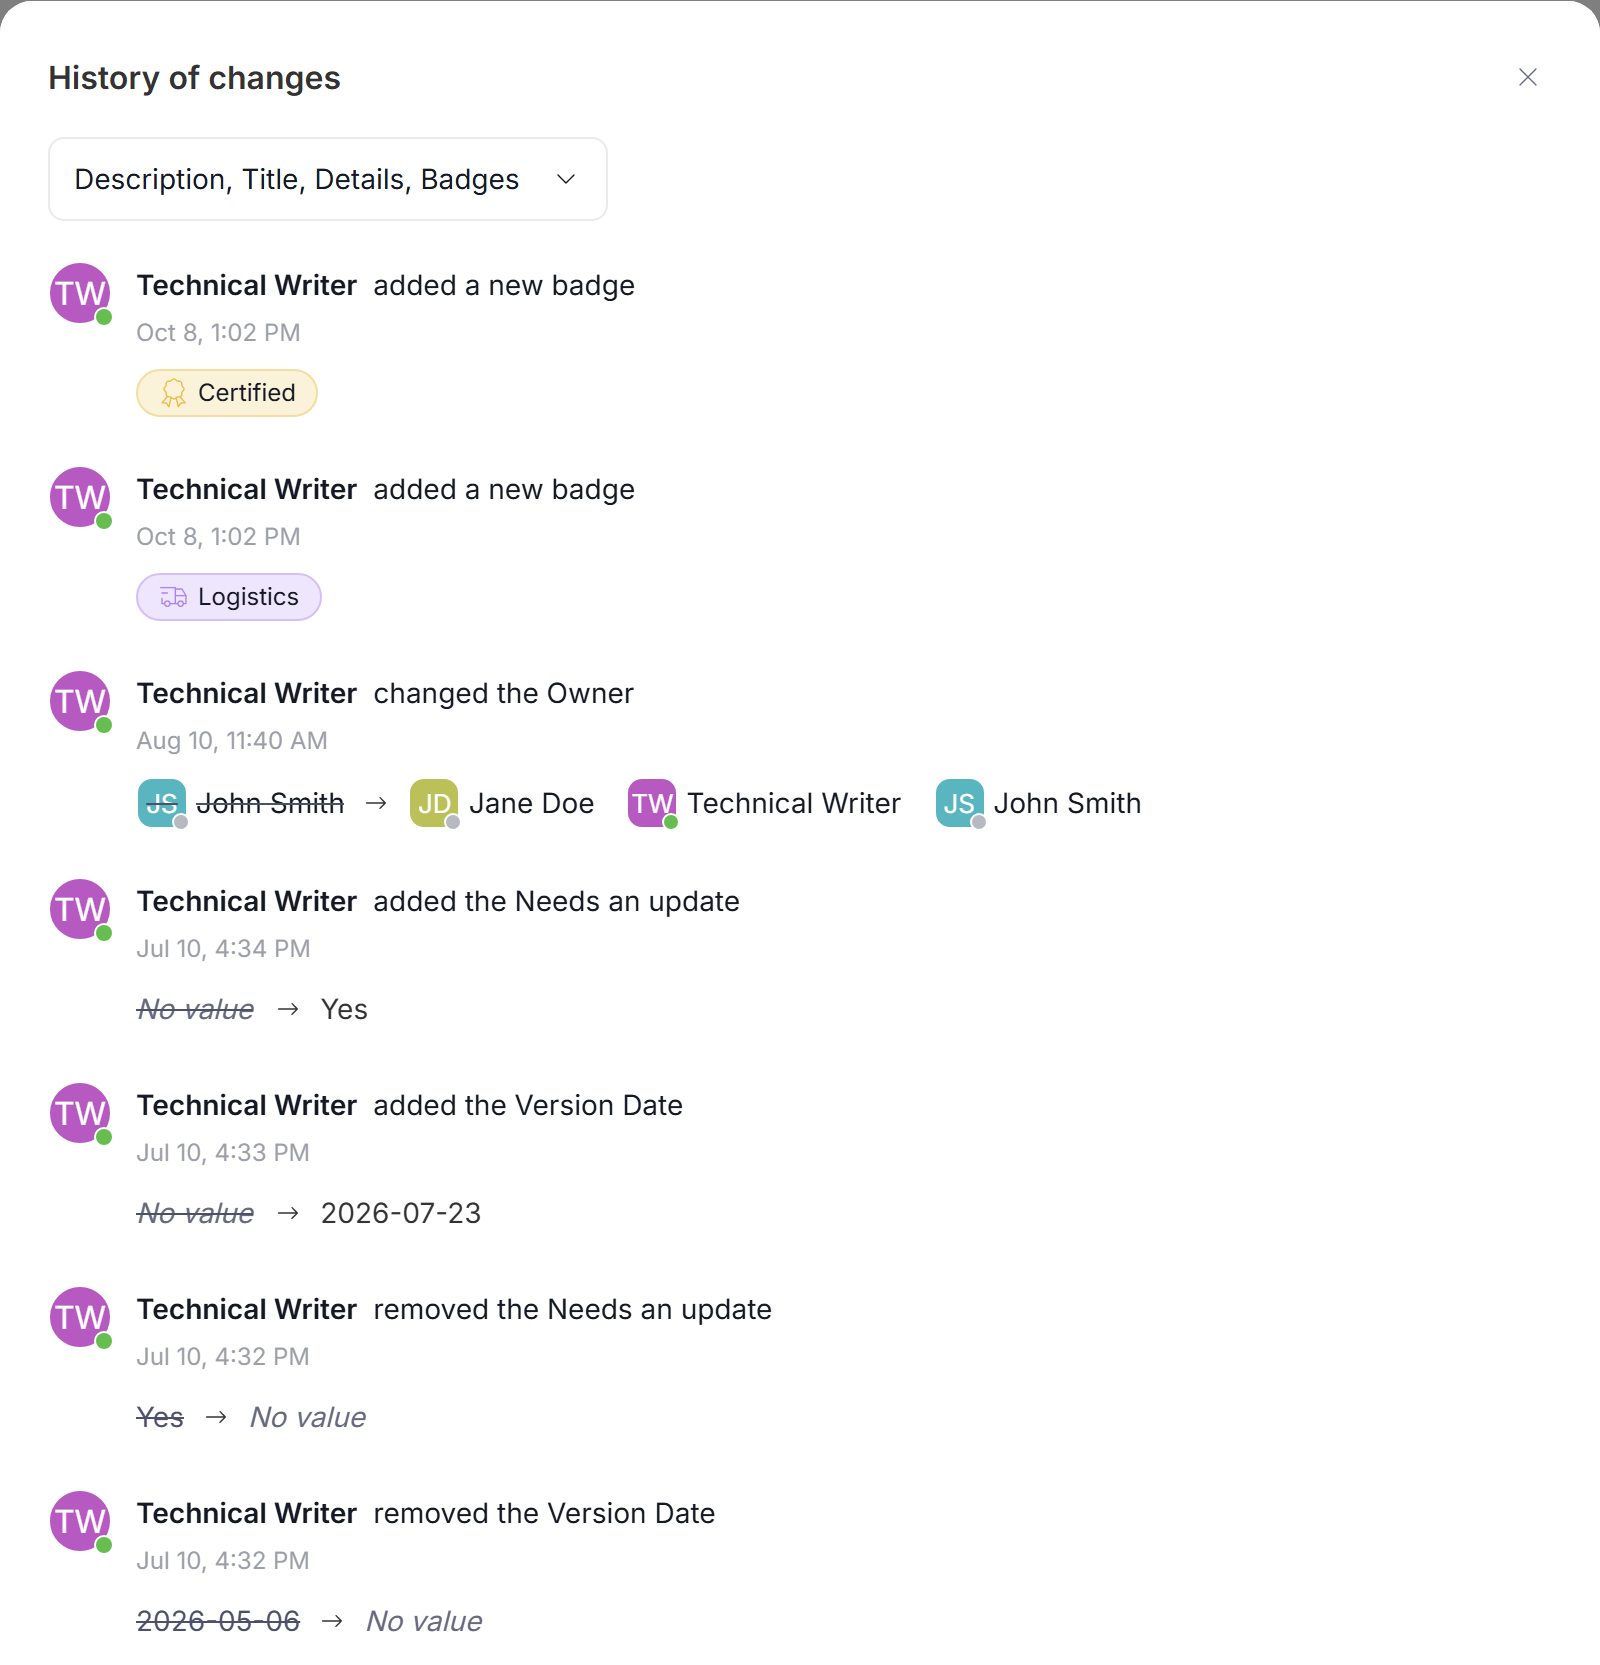
You can access the history, via an asset's three dot menu.
Floating bulk action bar
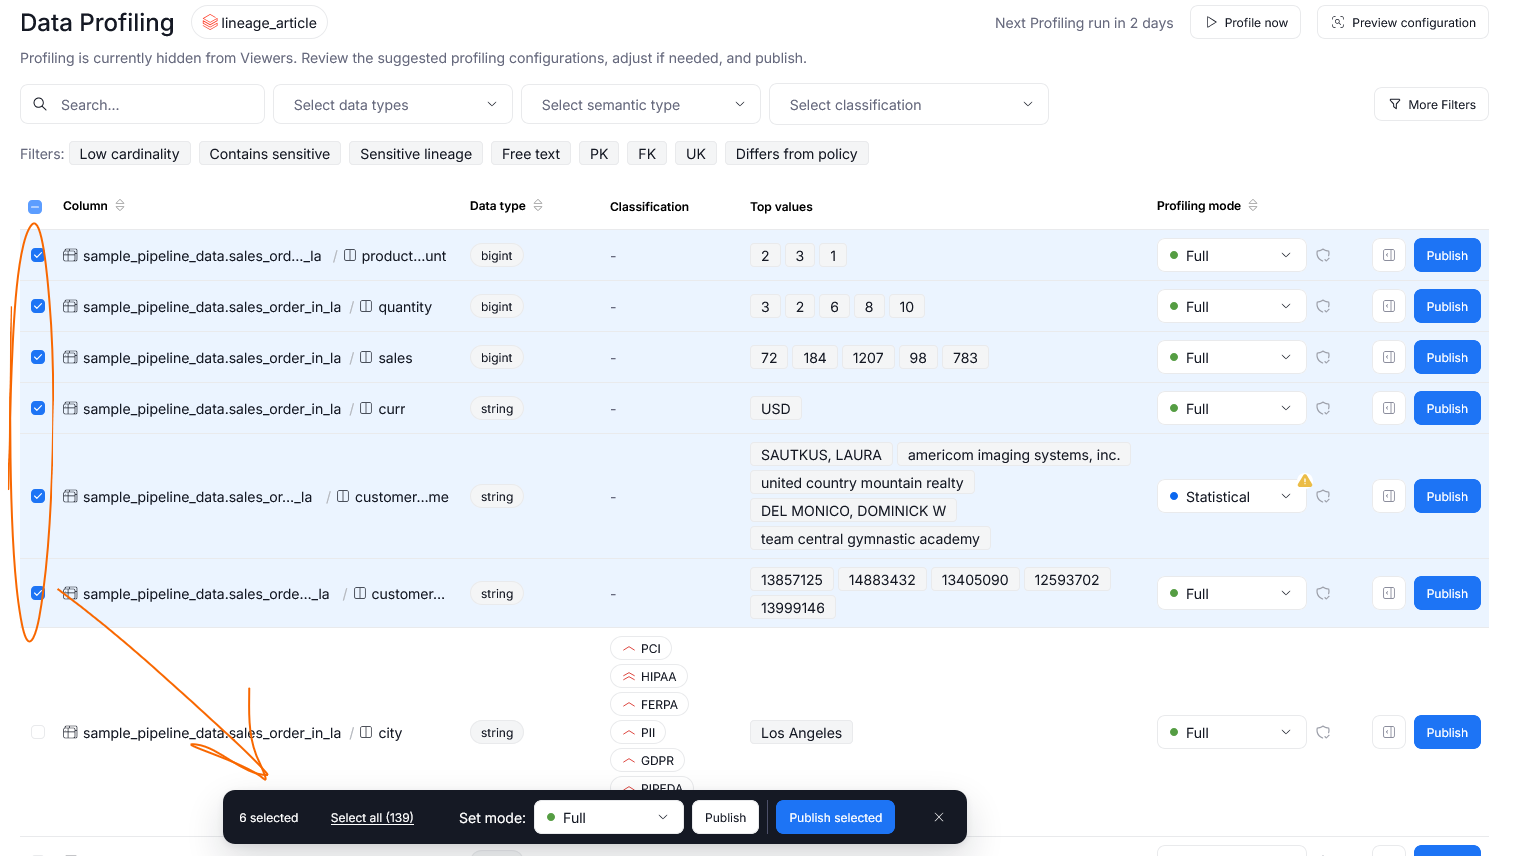
When you select multiple rows on a list that supports bulk actions, the bulk options now appear in a floating bar at the bottom of the screen. The bar does not move the list, so you do not lose your place while selecting.
Redesigned side panels
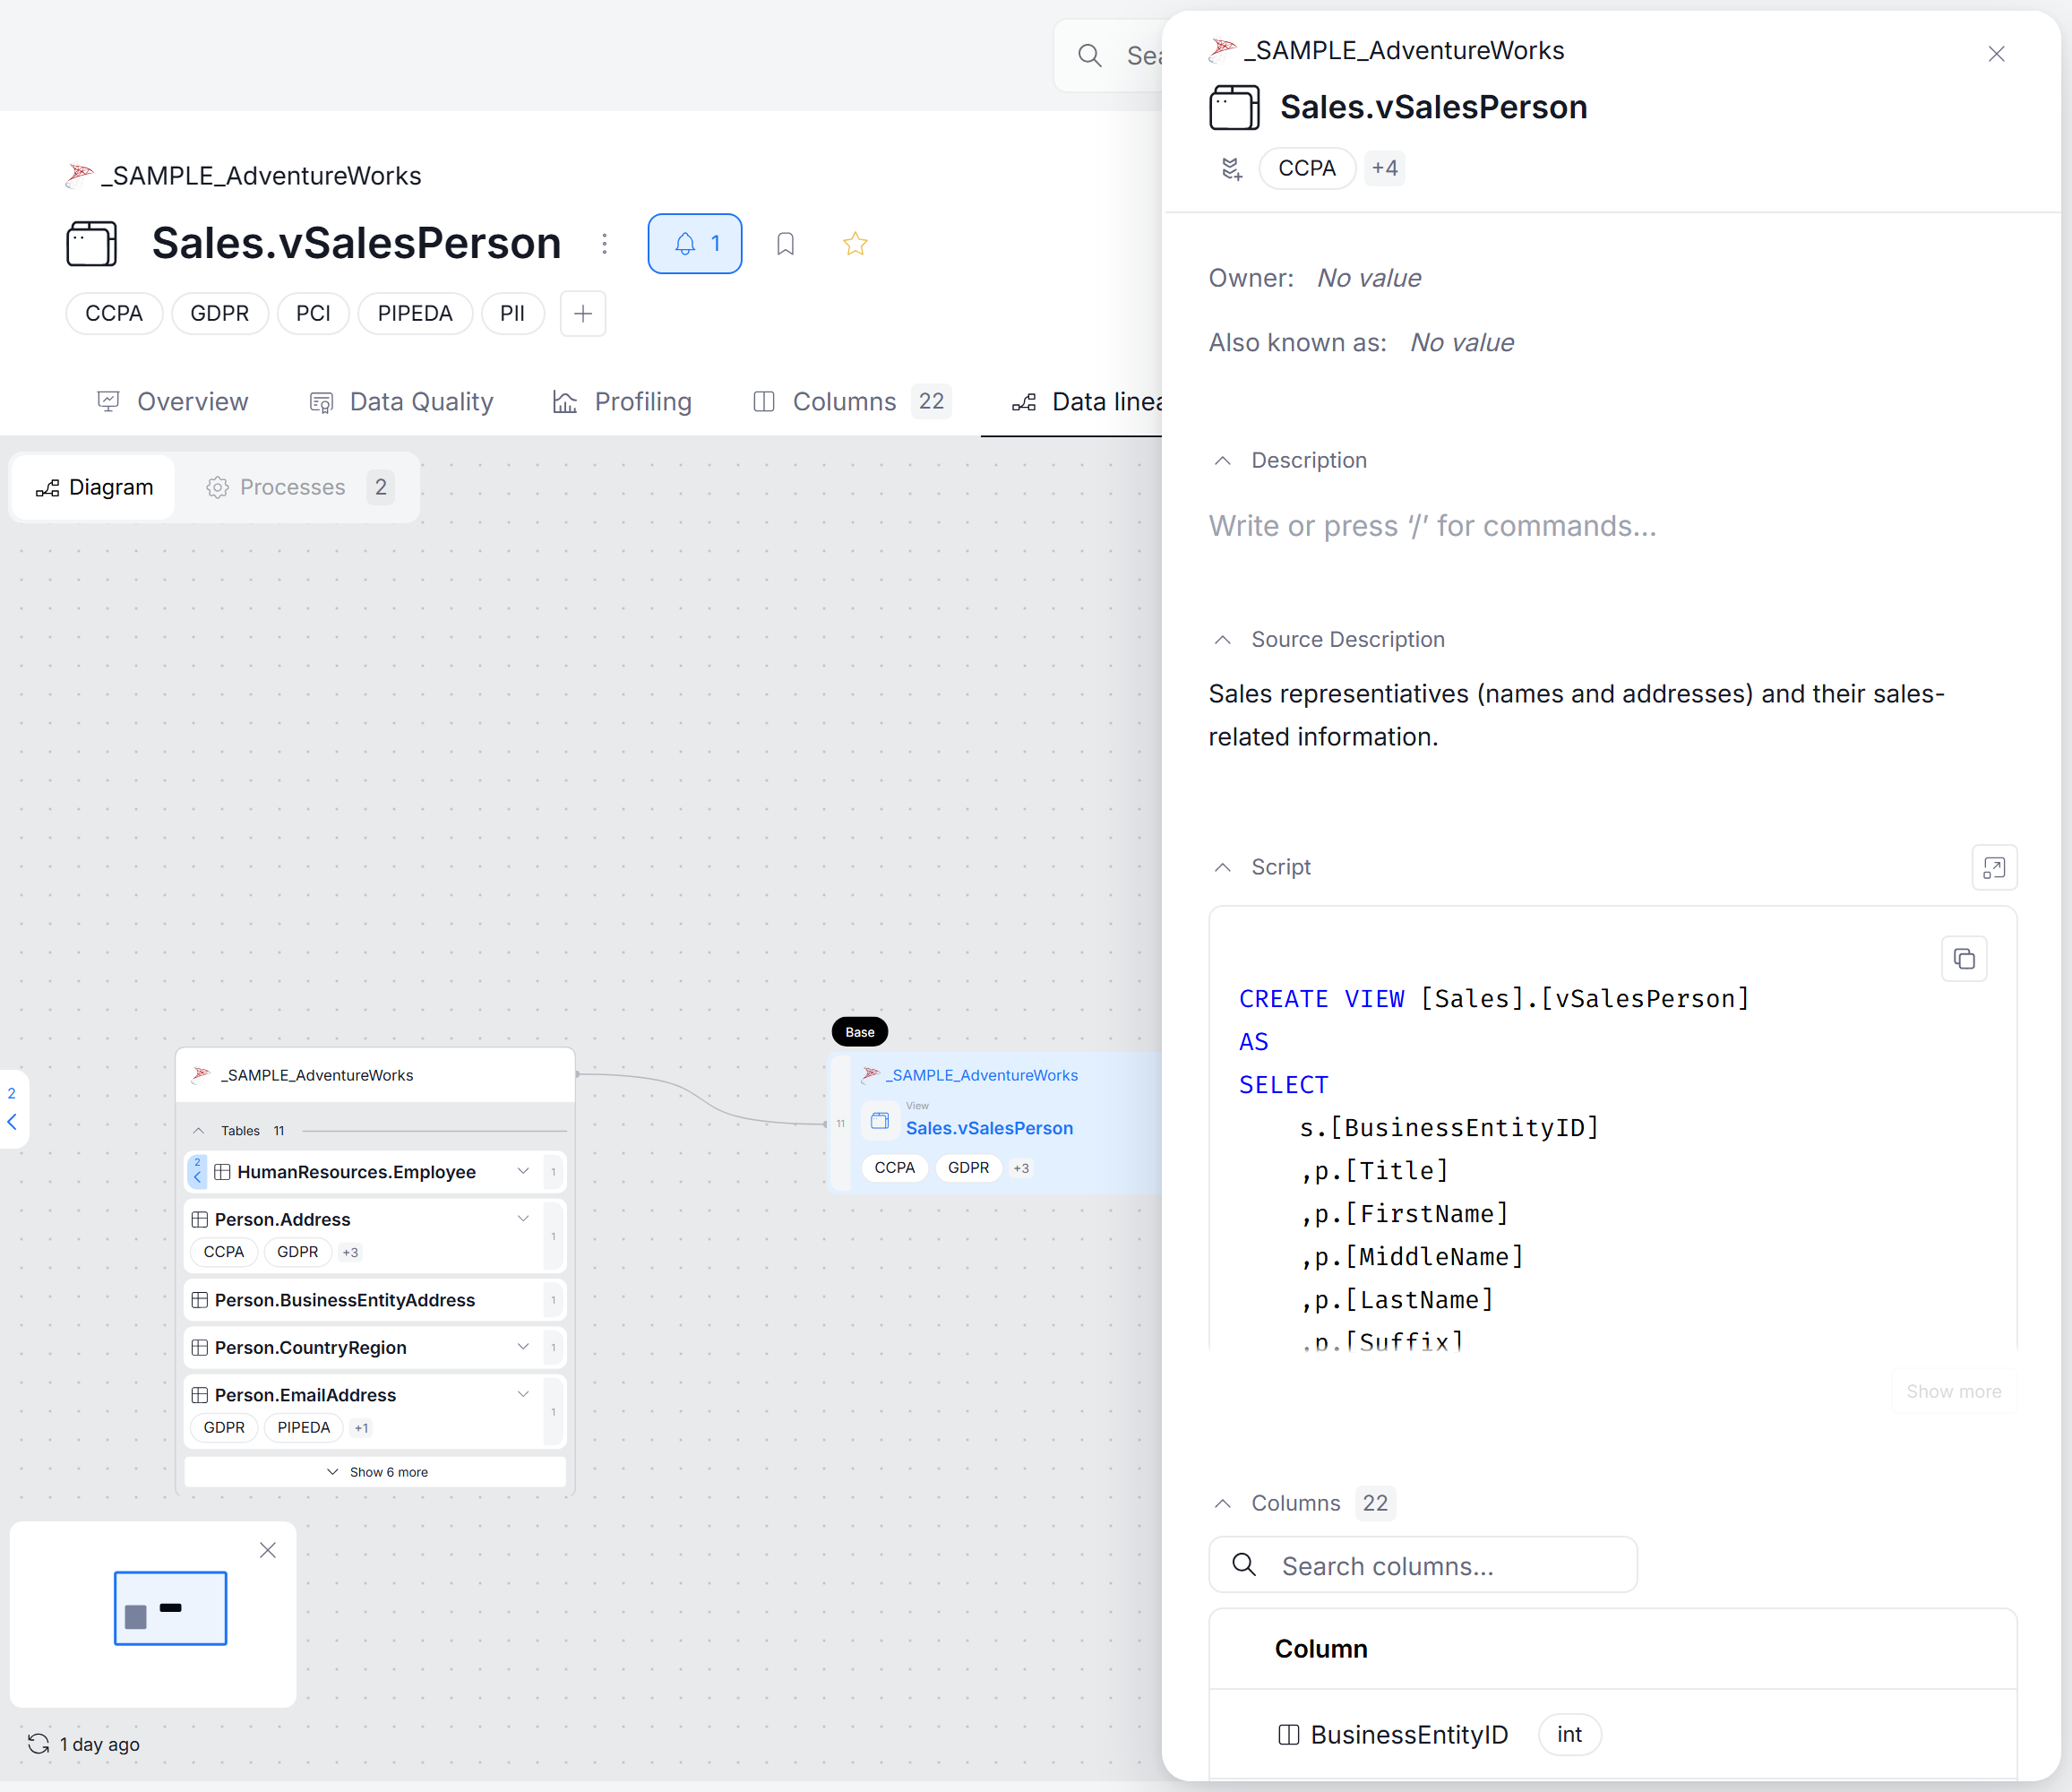
Side panels, such as the object preview in Data Lineage, got a new design. All of them now look and behave the same across Portal.
Homepage
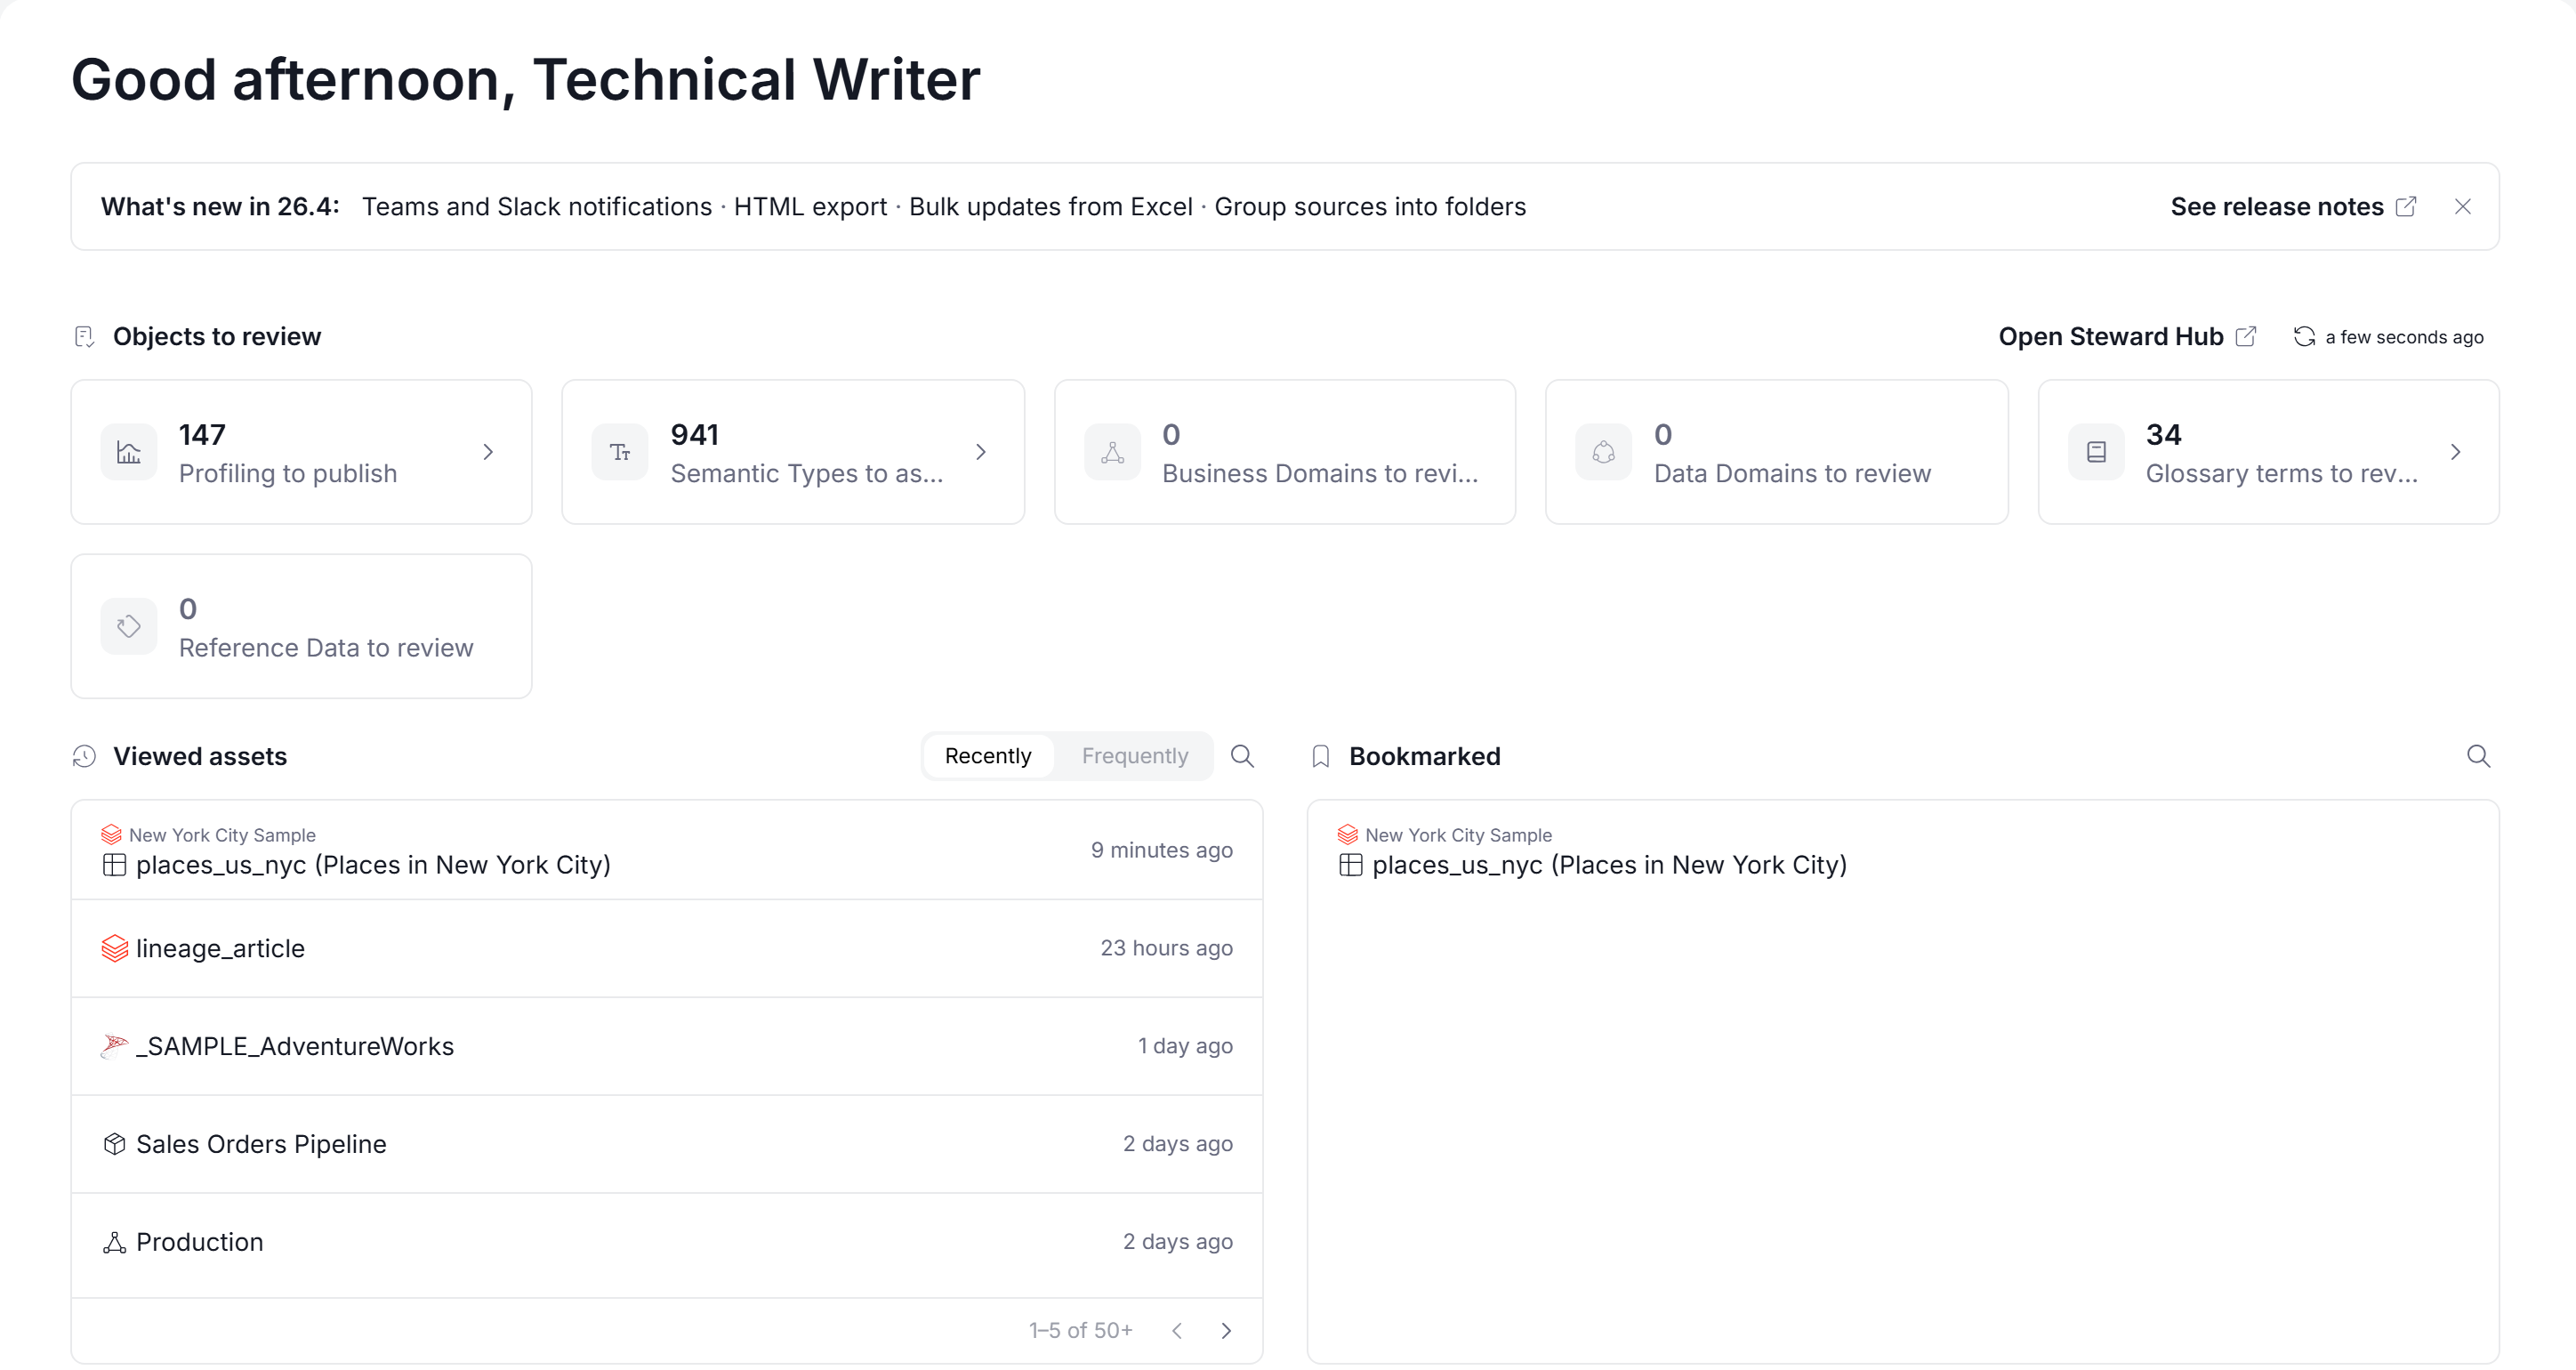
The homepage got a cleaner layout, with a What's new banner and an Objects to review section at the top. The Viewed assets widget now has separate tabs for recently and frequently viewed objects.