Release notes 26.3
HIGHLIGHTS
- MCP integration — connect AI models and assistants like Claude and Copilot Studio to your repository for grounded, read-only insights
- PostgreSQL repositories — new repository engine for Portal, plus a CLI command to safely migrate from SQL Server
- Data Profiling reworked — now fully in Portal, with Data Source dashboards and an Unsupported columns view
- Configurable Tabs — admins and users can customize tab visibility to keep the UI focused on what matters to them
- ERD diagrams for areas — auto-generated, editable ERD diagrams for Domains' areas
- Browser Extension — added an overlay extension button, the ability to add assets directly from the web, and support for viewing and joining Community discussions
- Execution Flows — interactive diagrams visualizing how a stored procedure, function, or ETL pipeline executes
- Multiple Agents — run multiple Agents in your repository and assign specific Agents to specific Connections
- Documenting JSON fields — parse and document the internal structure of JSON columns from SQL Server and PostgreSQL
- Custom Fields — pin important fields, assign multiple users to User Custom Fields, and add Custom Fields to Data Quality Rule Instances
- Other changes — folder-based filtering for Power BI Report Server/SSRS/Tableau, new authentication options, permissions now managed exclusively through User Groups, a reworked Community module, configurable task timeouts, two-way Metadata Sync of descriptions, and user activity & responsibilities tracking
Breaking changes: .NET Version
The application now targets .NET 10.0, replacing the previous .NET 9.0 dependency. To ensure compatibility, the .NET 10.0 must be installed on all environments running the application.
Download: https://dotnet.microsoft.com/en-us/download/dotnet/10.0
Integrate with AI using MCP
Dataedo 26.3 introduces MCP support — you can now connect AI models and assistants to your repository, giving them controlled, read-only access to your metadata so they can answer questions grounded in your actual catalog instead of guessing.
Why integrate AI with your repository
A general-purpose chatbot has no awareness of your repository's structure or contents, and will fill that gap with assumptions, leading to hallucinated answers. With MCP integration, a model can read data in your repository, giving you better, more reliable insights from the same prompts. MCP also lets you integrate with Microsoft Teams for a chat experience your whole organization can use.
What is MCP
MCP (Model Context Protocol) is an open standard for connecting AI agents to external systems safely — think of it as an API made for AI models. Dataedo's MCP server is a standalone service that sits between your AI client and Dataedo: it translates the model's requests into calls to Dataedo's API, which reads from your metadata. Access is always read-only and scoped to what your Dataedo account is allowed to see.
Once connected, an AI client can:
- search your catalog for objects by name, title, or description
- get detailed information about tables, columns, databases, Data Lineage, and more
- list tables and procedures in a specific database, optionally filtered
Hosted Mode vs. Local Mode
The MCP server can run in one of two modes, depending on the AI client you want to connect:
- Hosted Mode — the server runs centrally (e.g. on a company server) and cloud-based clients like Copilot Studio or Claude (web) connect to it over a URL. Users sign in through your Dataedo instance's own login page (including SSO).
- Local Mode — the server runs on your own machine, launched directly by a desktop AI app like Claude Desktop. You authenticate with a Personal Access Token, generated from your Dataedo profile.
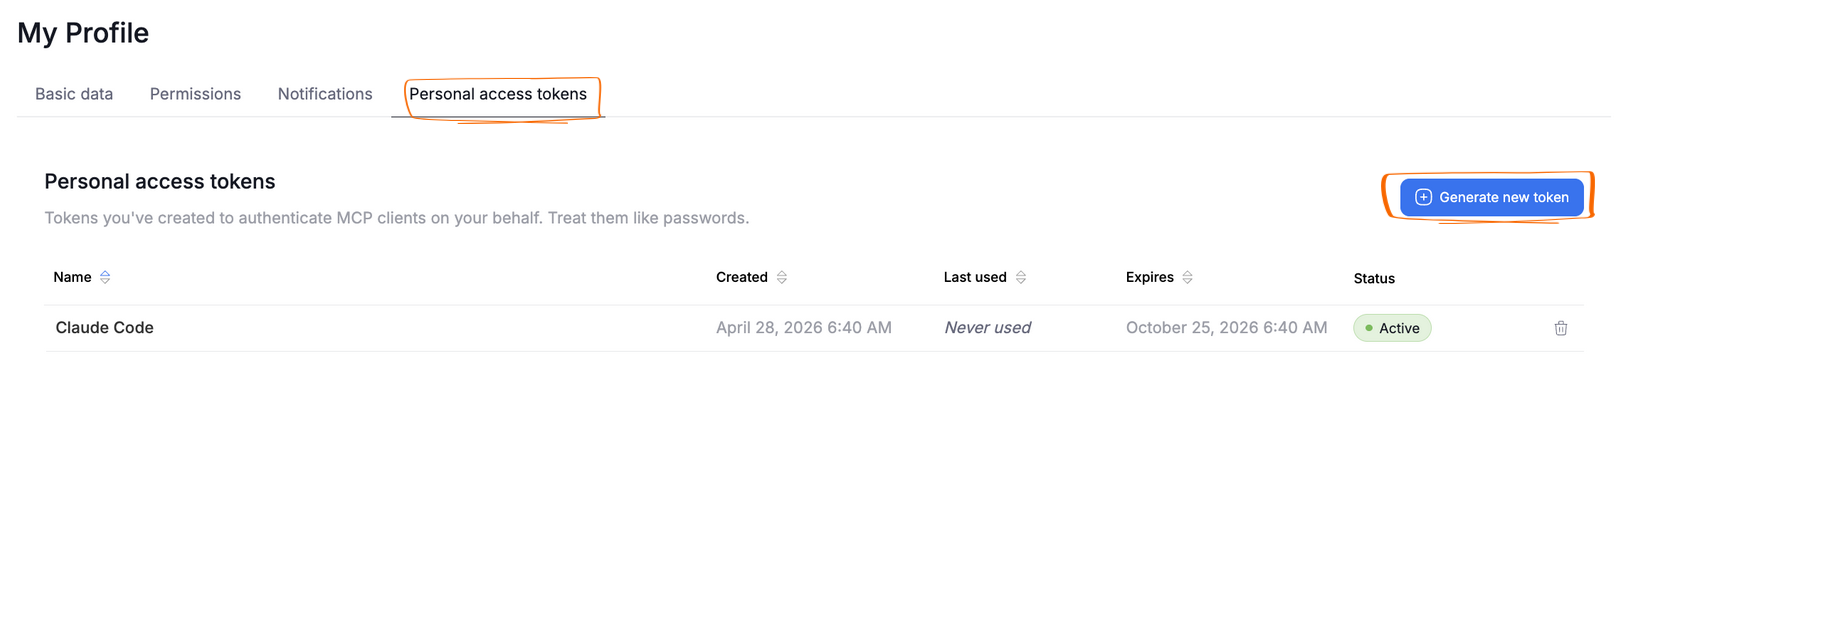
Learn more about setting up MCP for your AI client here.
PostgreSQL repositories
PostgreSQL repositories are supported only in Dataedo Portal, not in Desktop — if you move your repository, you will lose access to desktop functionalities
Dataedo 26.3 adds support for repositories hosted on PostgreSQL, in addition to the existing SQL Server and Azure SQL options. You will now see the option to connect to a PostgreSQL repository when first setting up Portal:
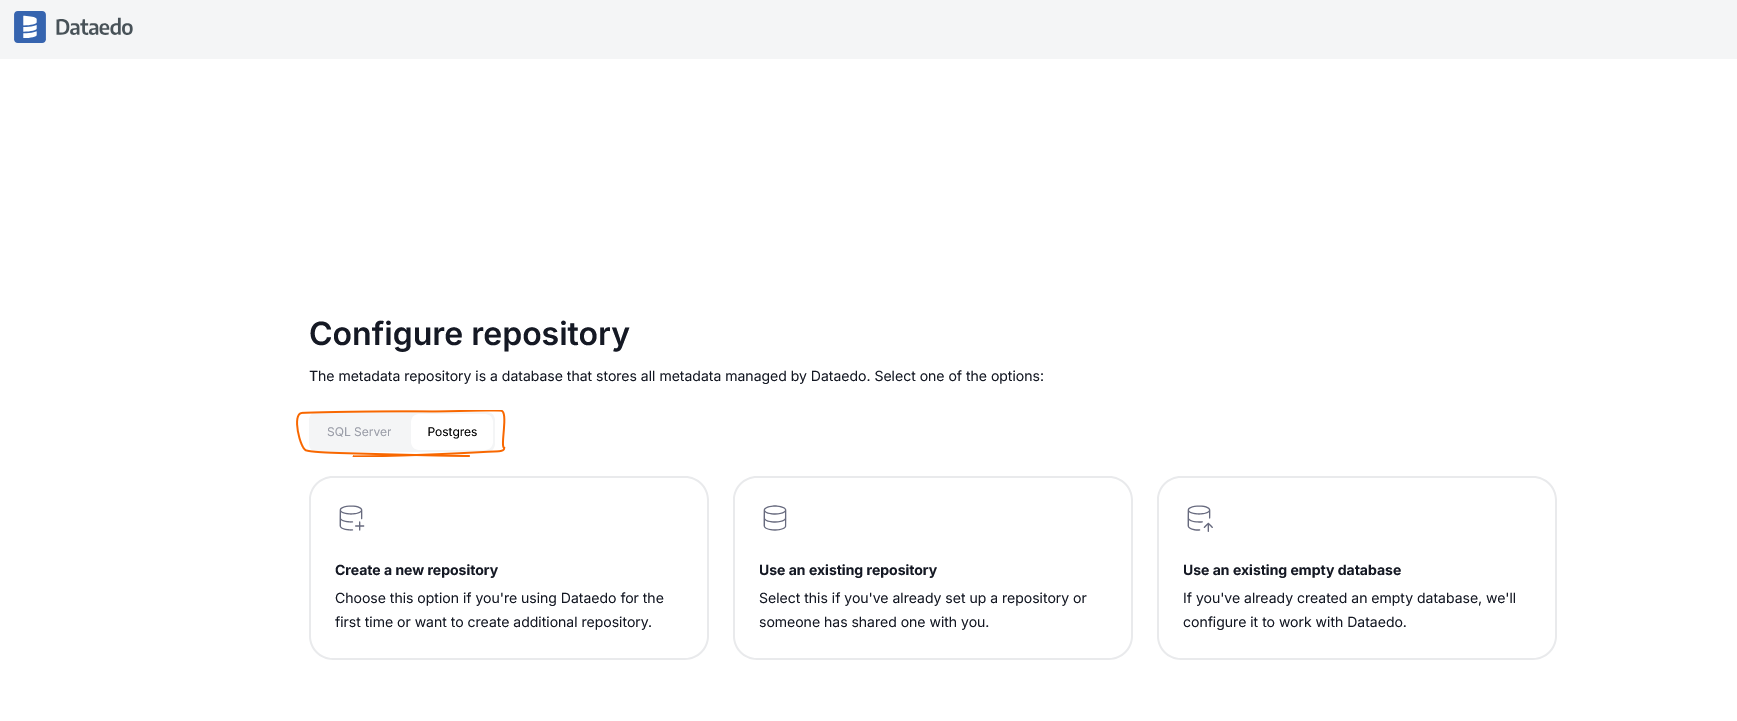
The added support for PostgreSQL does not affect other repository types — SQL Server and Azure repositories are still supported. If you want to keep using your old repositories, you do not have to change anything in the configuration. Dataedo will still function as it used to.
Migrating a repository to PostgreSQL
A new Dataedo CLI command, copy-to-postgres, lets you safely migrate an existing SQL Server repository to PostgreSQL without setting everything up from scratch. Learn more here.
New profiling in Portal
Data Profiling has moved to Portal in version 26.3. Learn more about Data Profiling. This change comes together with a profiling rework: we added new widgets, customizable profiling logic, and a dedicated Steward Hub module.
Configuration
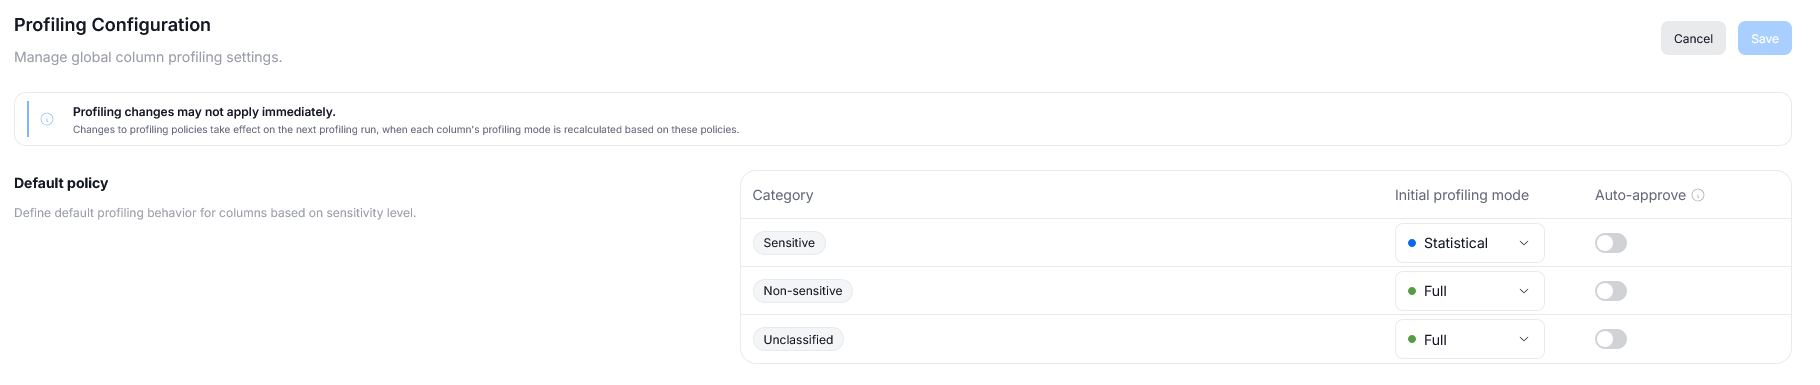
Profiling now runs in one of three modes — Full, Statistical, or None — configured globally per data classification, with exceptions available for specific classifications. Learn more here.
Publishing
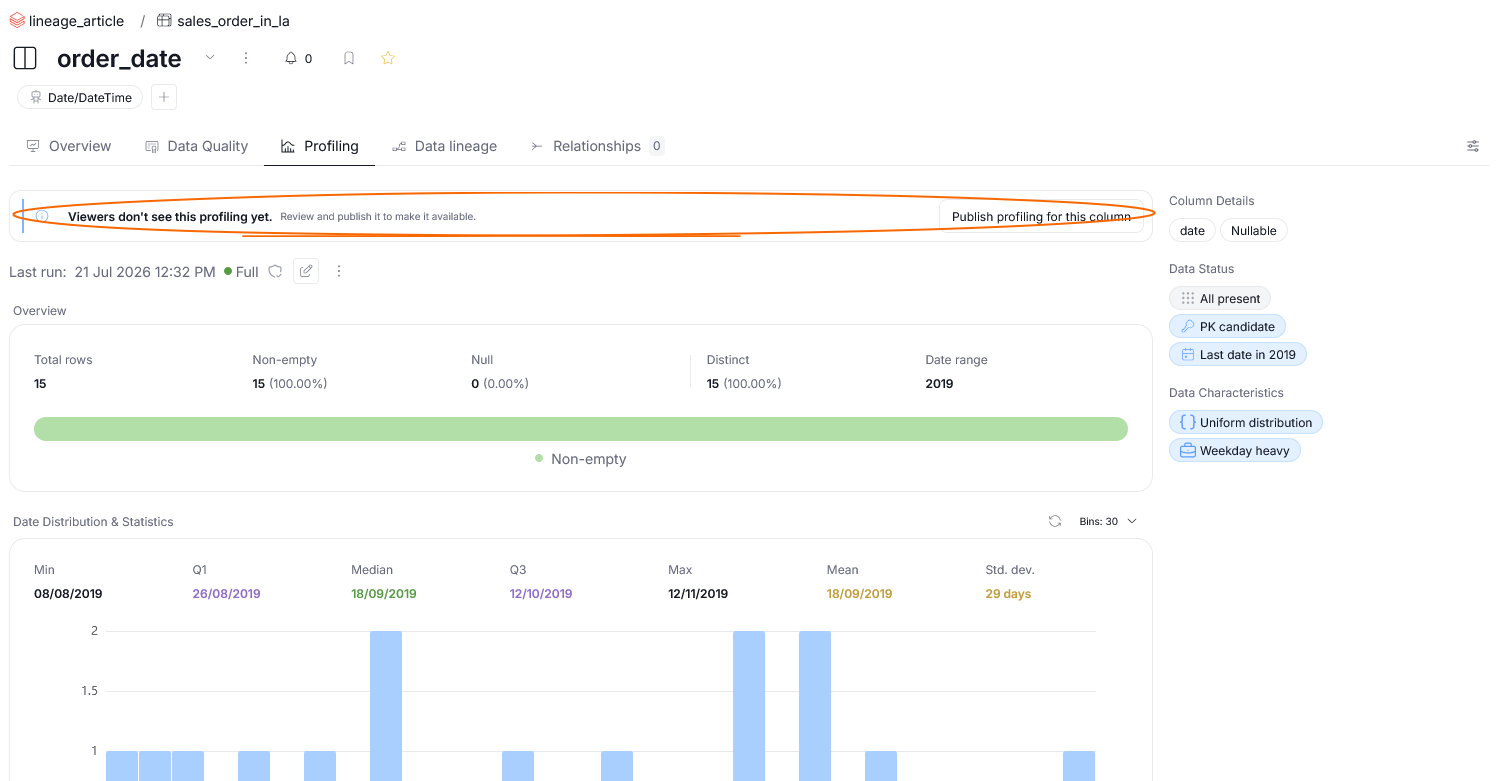
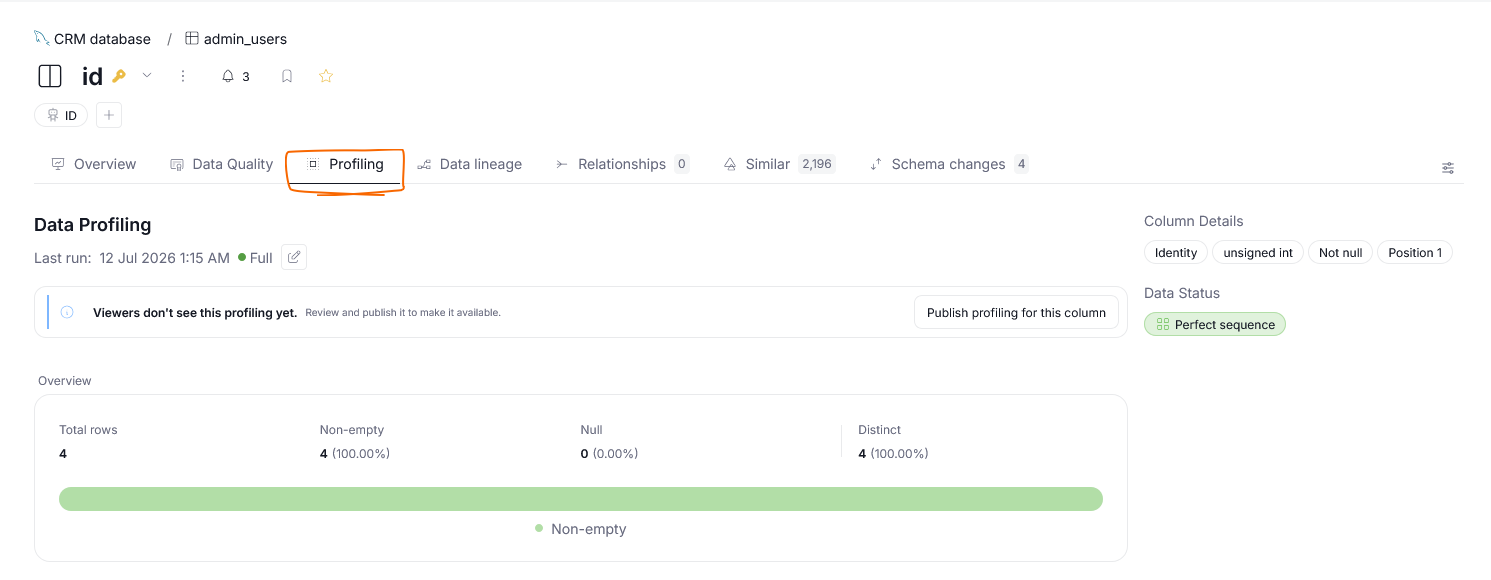
Profiling results can be published or kept unpublished, controlling whether they are visible only to Data Stewards or to the rest of your organization. Results can be published and unpublished from an asset's Profiling tab, or reviewed and published in bulk from the Steward Hub. Learn more here.
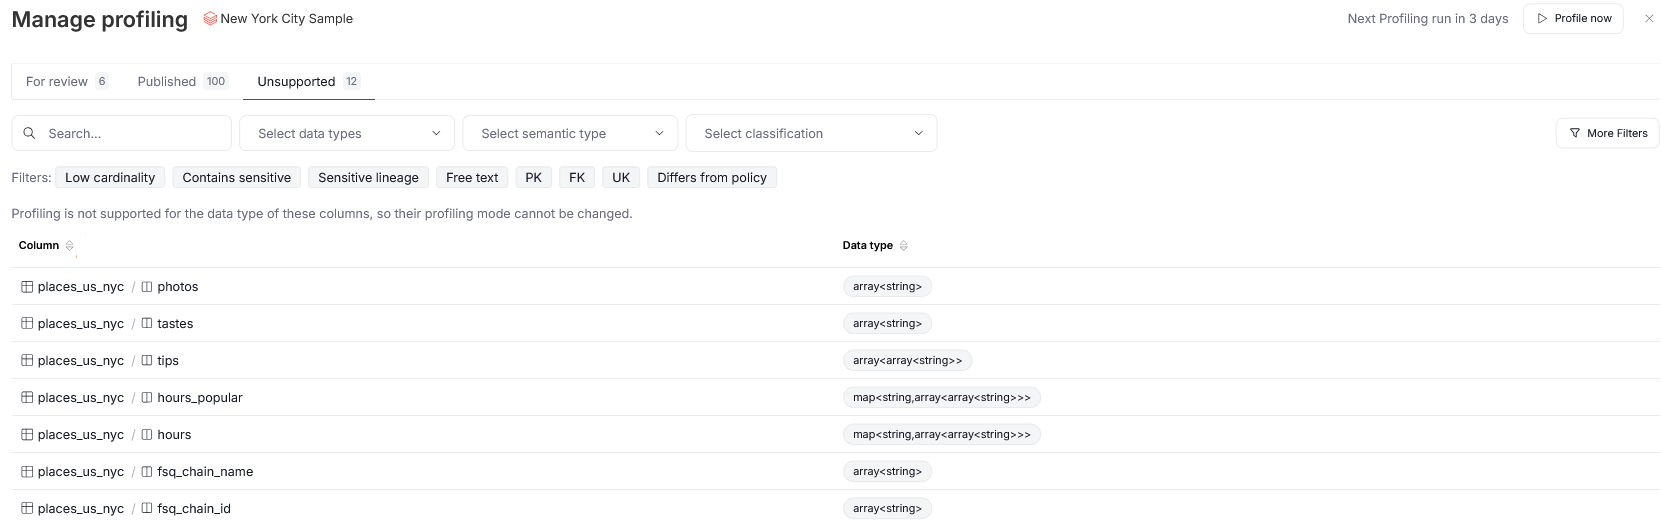
The Manage profiling grid also has an Unsupported tab, listing columns that cannot be profiled because of their data type.
Viewing results
Profiling results are shown in an asset's Profiling tab as a set of badges, graphs, and widgets summarizing your data's characteristics at a glance. Learn more here. Which widgets appear is determined based on the object's Profiling results, making for a more streamlined experience.
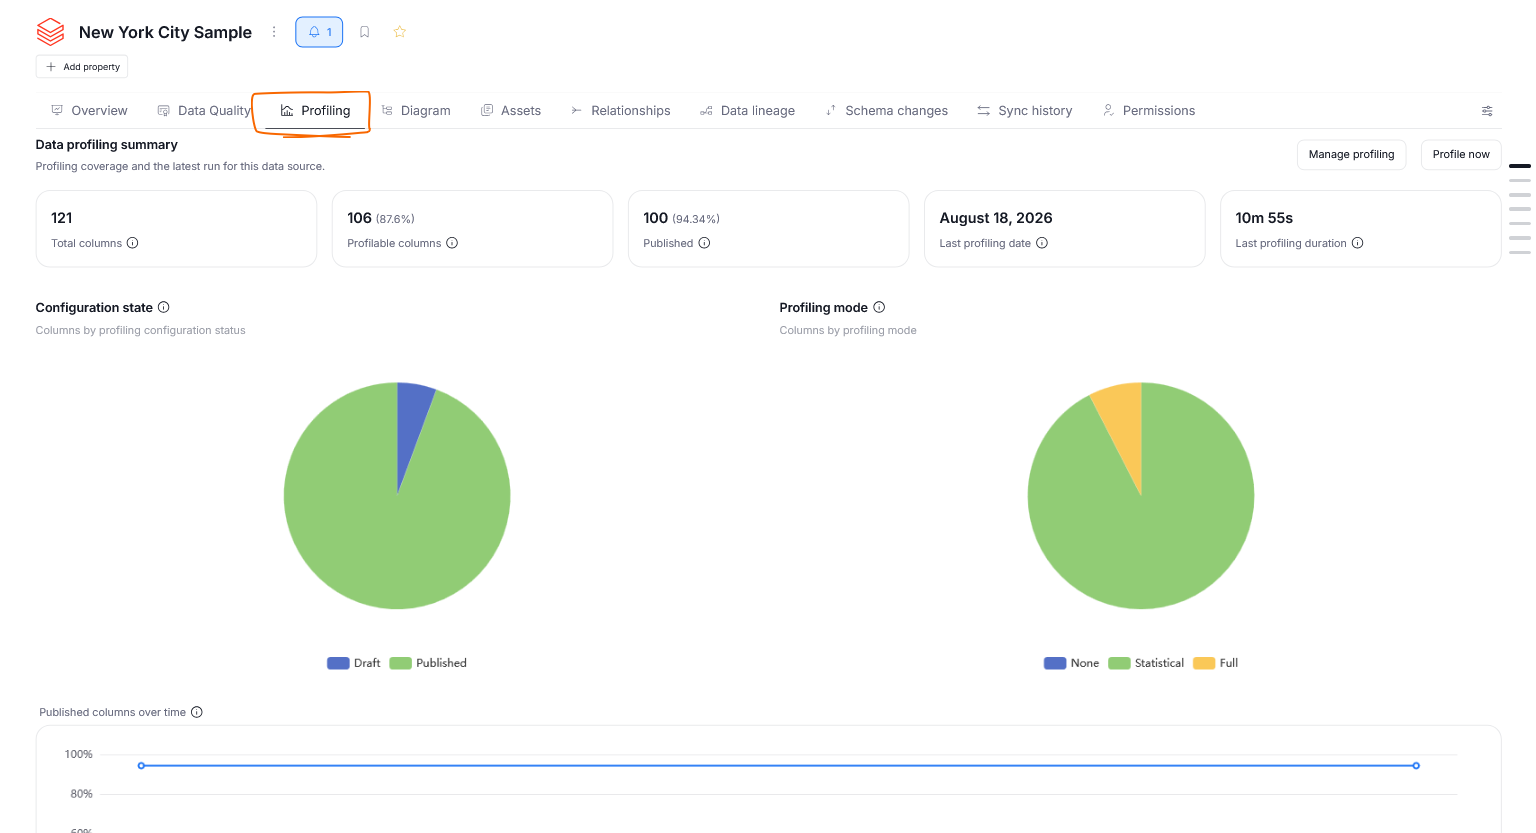
Each Data Source also has its own profiling dashboard, summarizing statistics like the number of published columns, profiling duration, and changes in profiling over time.
Moving on from old profiling
History of profiling runs from before version 26.3 will still be kept in your repository
After you configure Data Profiling in Portal, confirm that everything works as intended, and confirm that all your data has been migrated, you can make extra space in your repository by running truncate on dbo.columns_profiling_history, dbo.column_values, and dbo.column_profile. This will remove unnecessary data related to old profiling in Desktop, while not affecting the actual profiling results.
Steward Hub
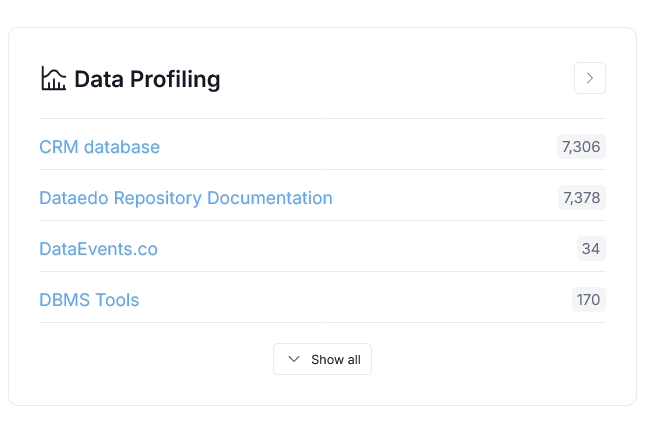
Steward Hub's Profiling section accompanies the transition of Data Profiling into Portal. You can use it to review, publish, and change the Profiling mode of columns across your repository in bulk. Find more details in the dedicated article.
Configurable Tabs
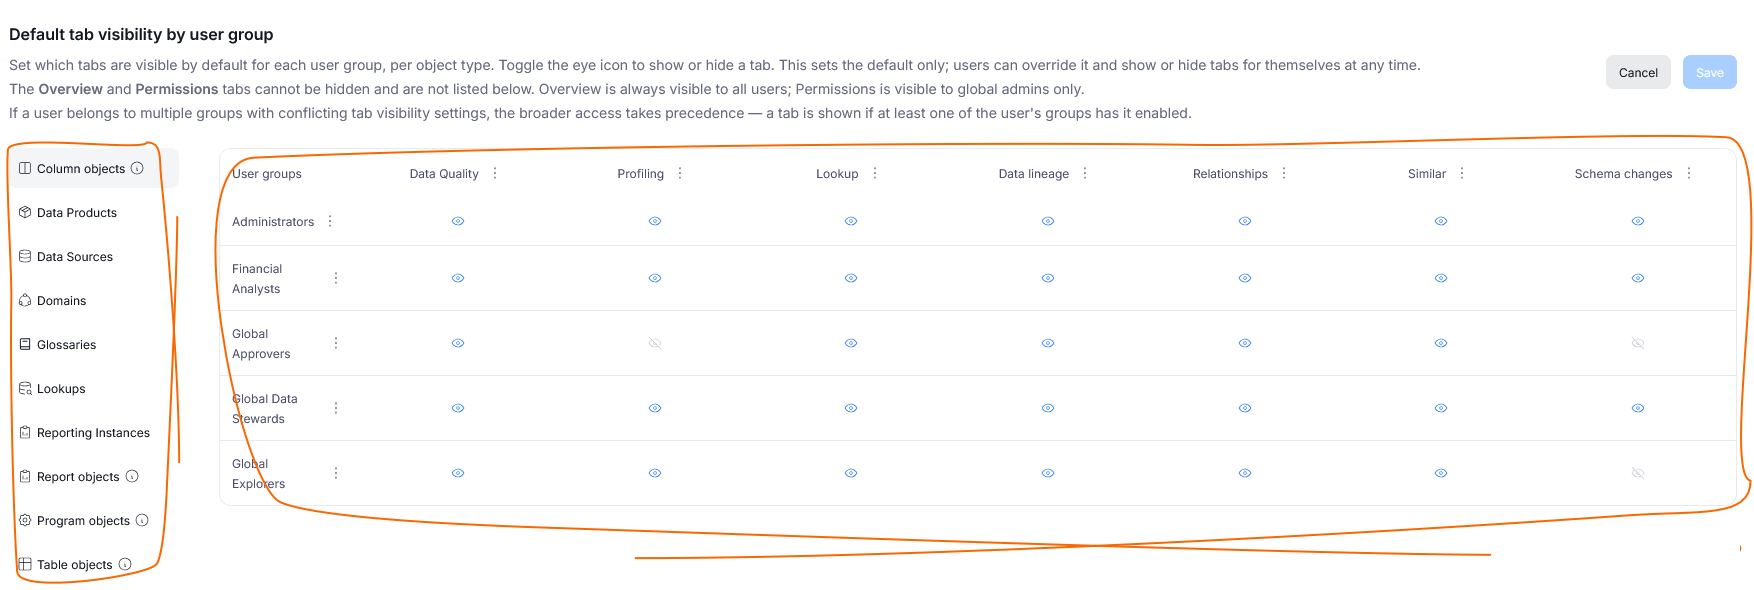
You can now customize tab visibility in your Dataedo instance. This customization helps your users stay focused, by highlighting only those tabs that are relevant to certain teams' needs.
Admins can carry out a platform-wide configuration: deciding which tabs should be visible for which User Groups.
Additionally, users can further fine-tune these configurations. Every user can customize their own tab visibility preferences, overriding the admin configuration.
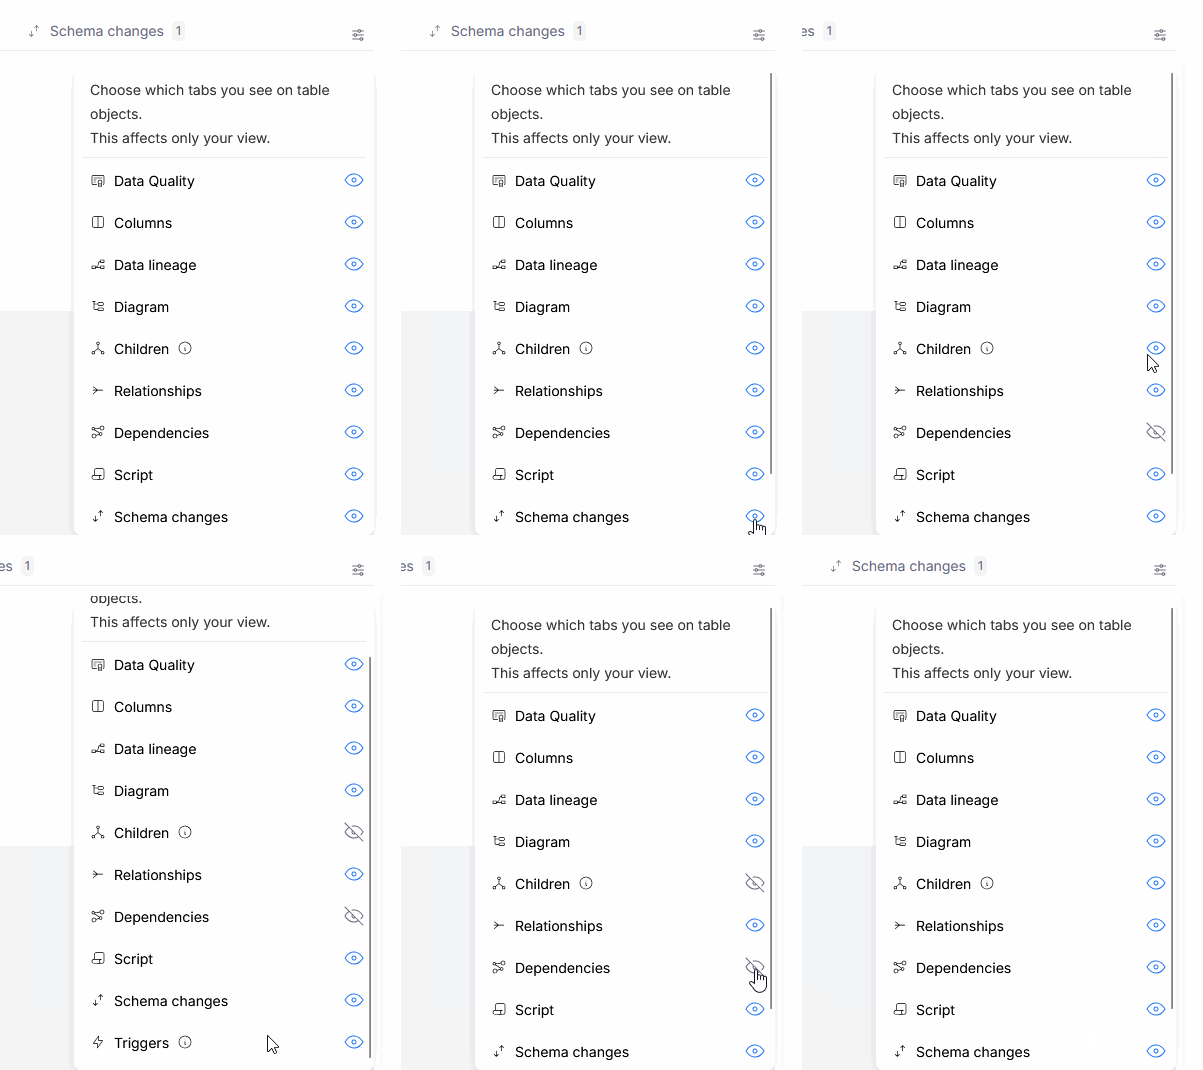
Tab visibility is a purely visual change. A disabled tab will be hidden from the user's UI but — as long as they have permissions to view it — its content will still be reachable via a hyperlink, or by clicking a relevant notification.
ERD diagrams for areas
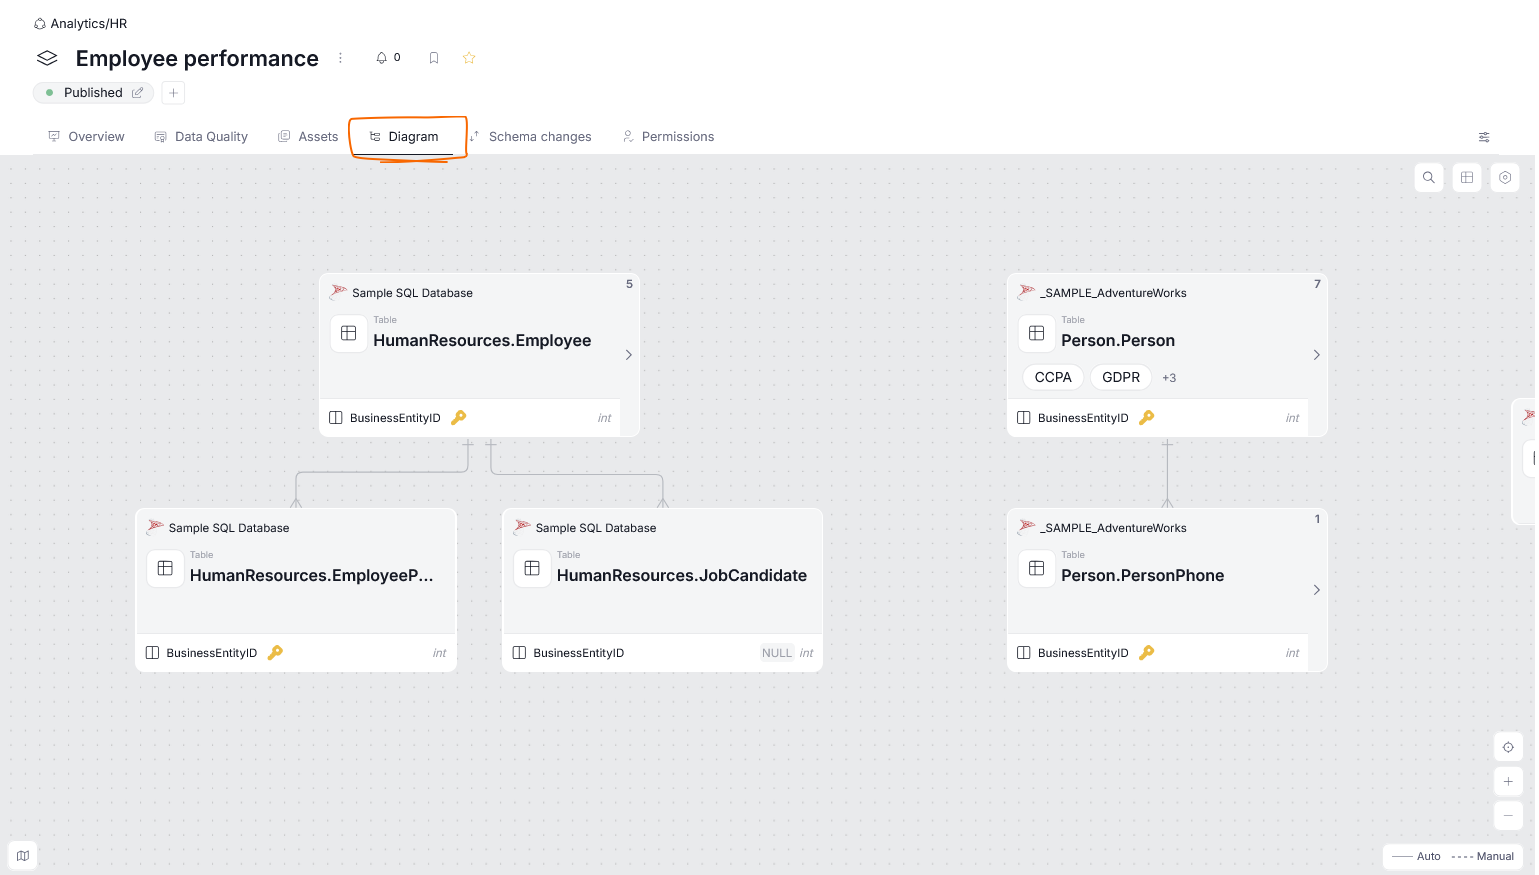
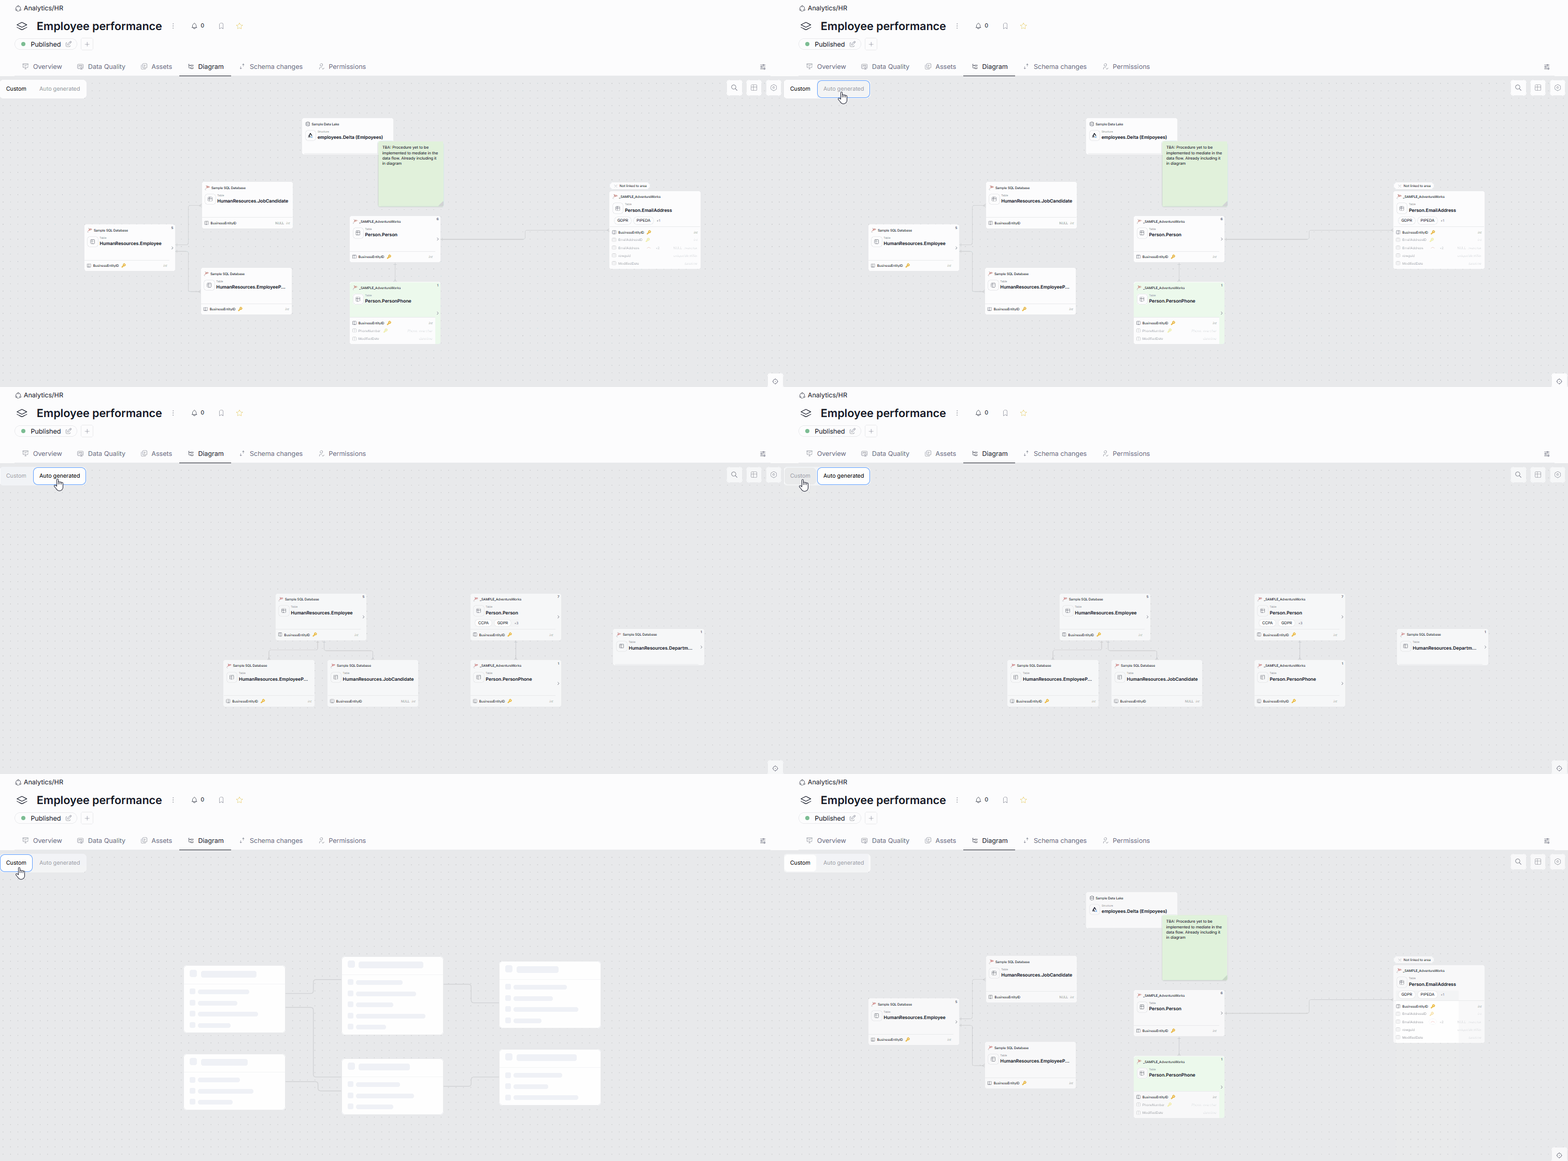
We refreshed the look and functionality of Domains' areas' ERD diagrams. The default diagram is generated automatically from existing links between your assets, and is available under an area's Diagram tab. You can also edit diagrams directly in Portal.
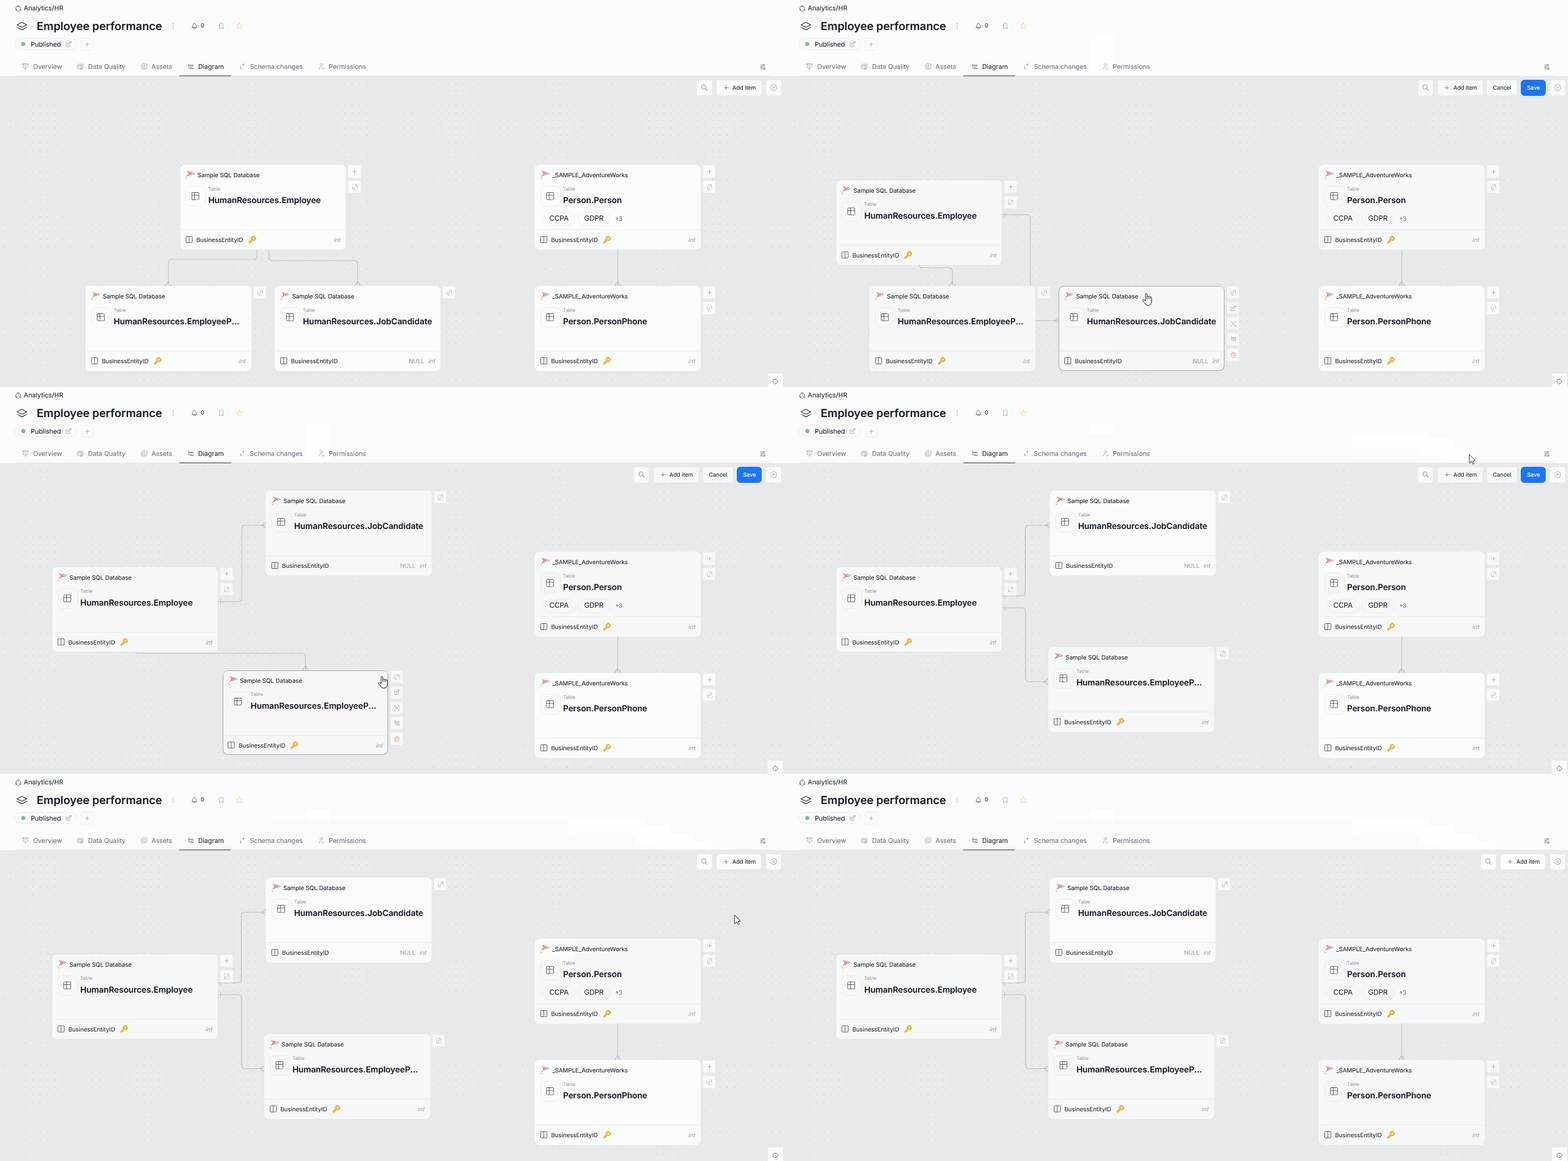
Editing area diagrams
You can customize an area's diagram using its Edit mode — rearrange nodes, add asset representations and sticky notes, and customize individual nodes.
Switching between edited and original area diagram
Once you save changes to an area's diagram, you can switch between that customized version and the original, auto-generated one.
Browser Extension
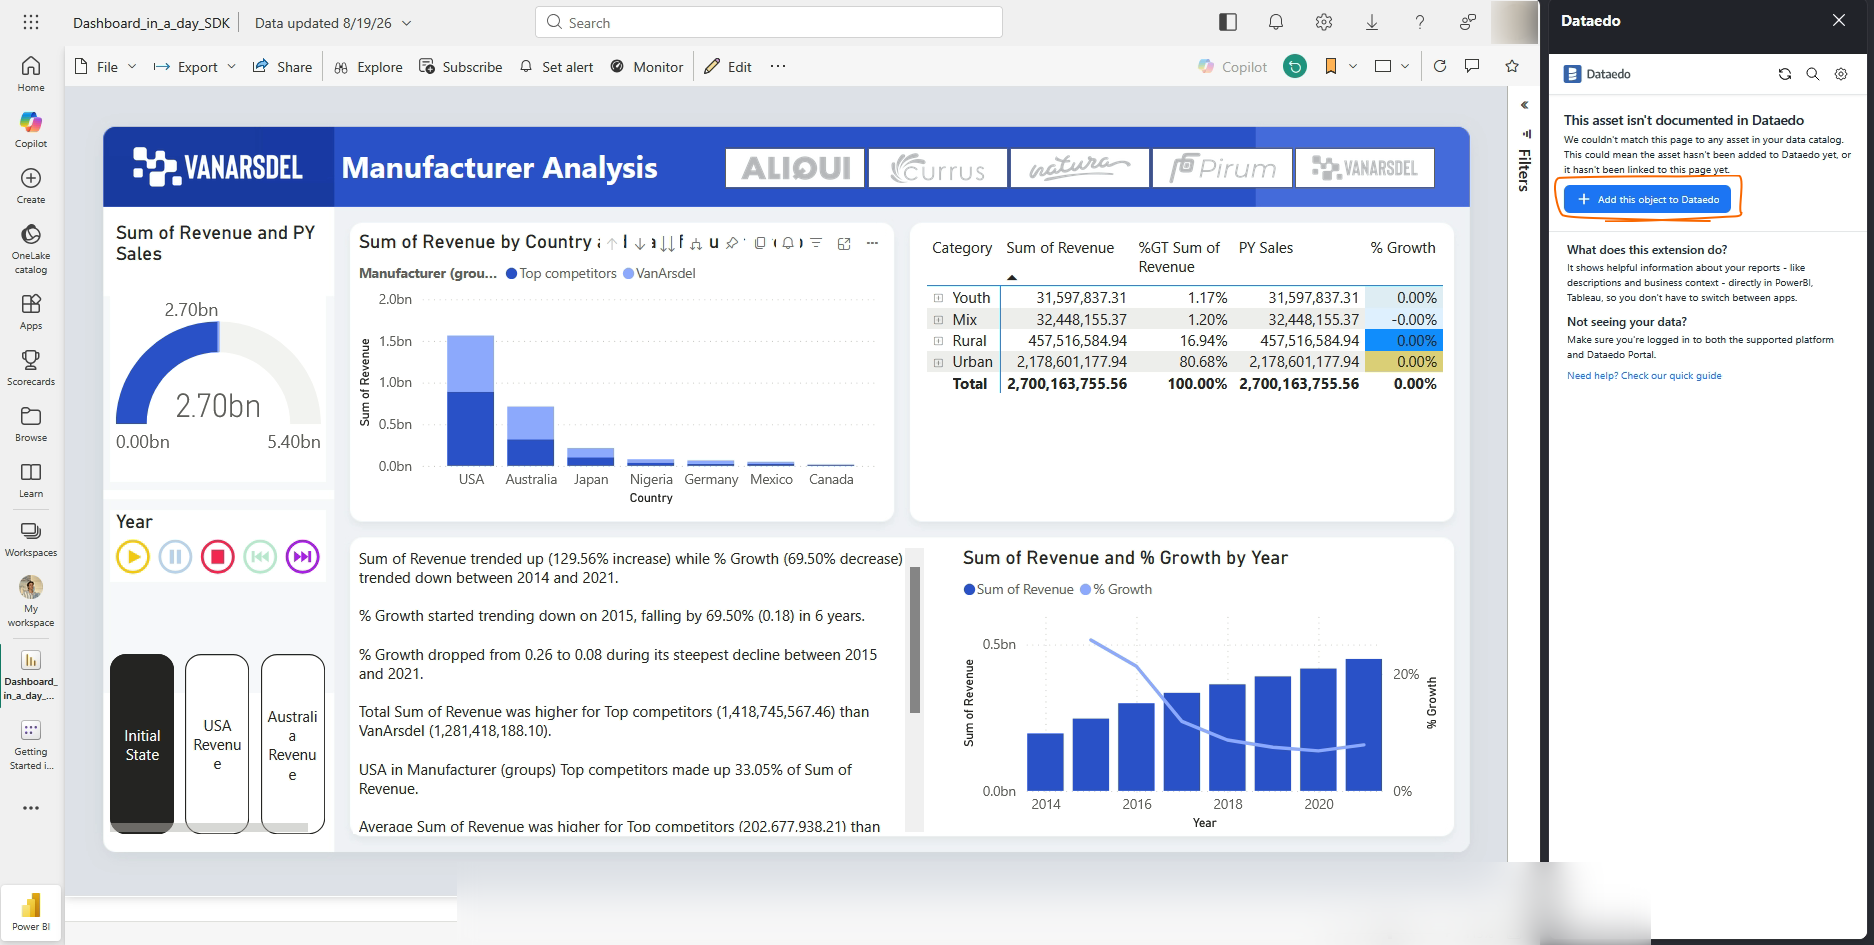
This version brings further improvements to our Browser Extension. We also changed the way you open it. You can still open the extension from your browser's sidebar, but it now also displays a small Dataedo icon in the bottom right of your screen whenever you are viewing a relevant asset. Clicking the icon opens the extension.
Adding assets
If you are viewing an asset that is not yet documented in Dataedo, the extension now lets you add it to your Data Catalog directly, using the Add this object to Dataedo button.
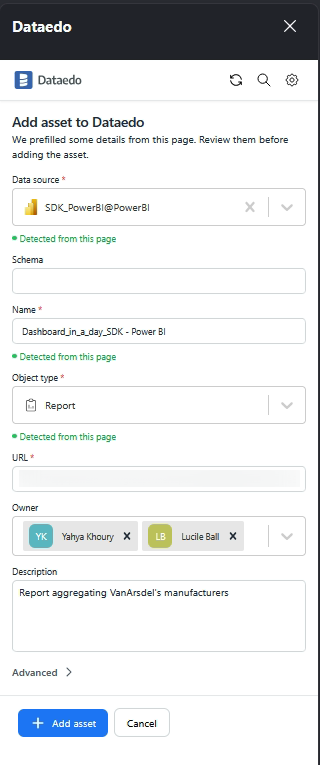
The extension auto-fills a form with as many details as it can detect from the page — Data Source, Schema, Name, Object Type, URL, Owner, and description — which you can review and complete before saving. Assets added this way also become available directly in Dataedo Portal.
Editing assets
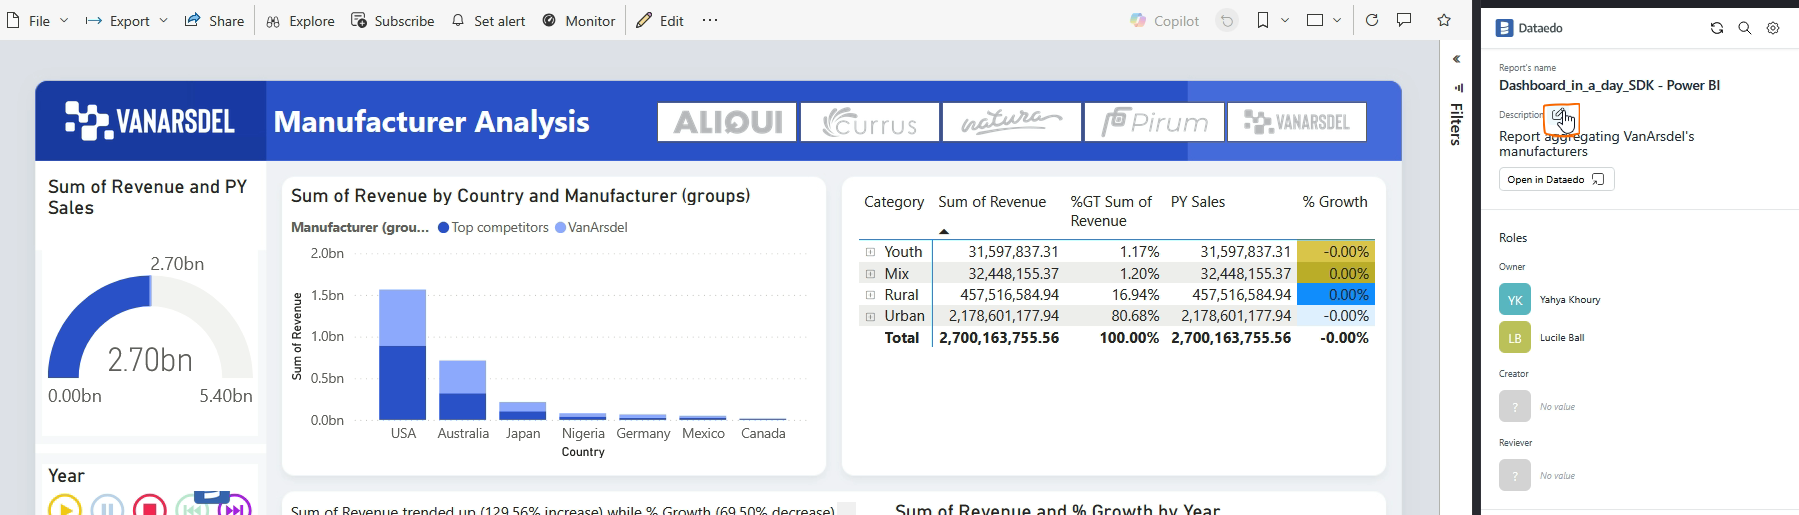
You can now edit an asset's documentation directly from the Browser Extension, without leaving the page you're on. Hover over a description or a role to reveal an Edit button.
Community
You can now view and participate in Community discussions directly from the Browser Extension.
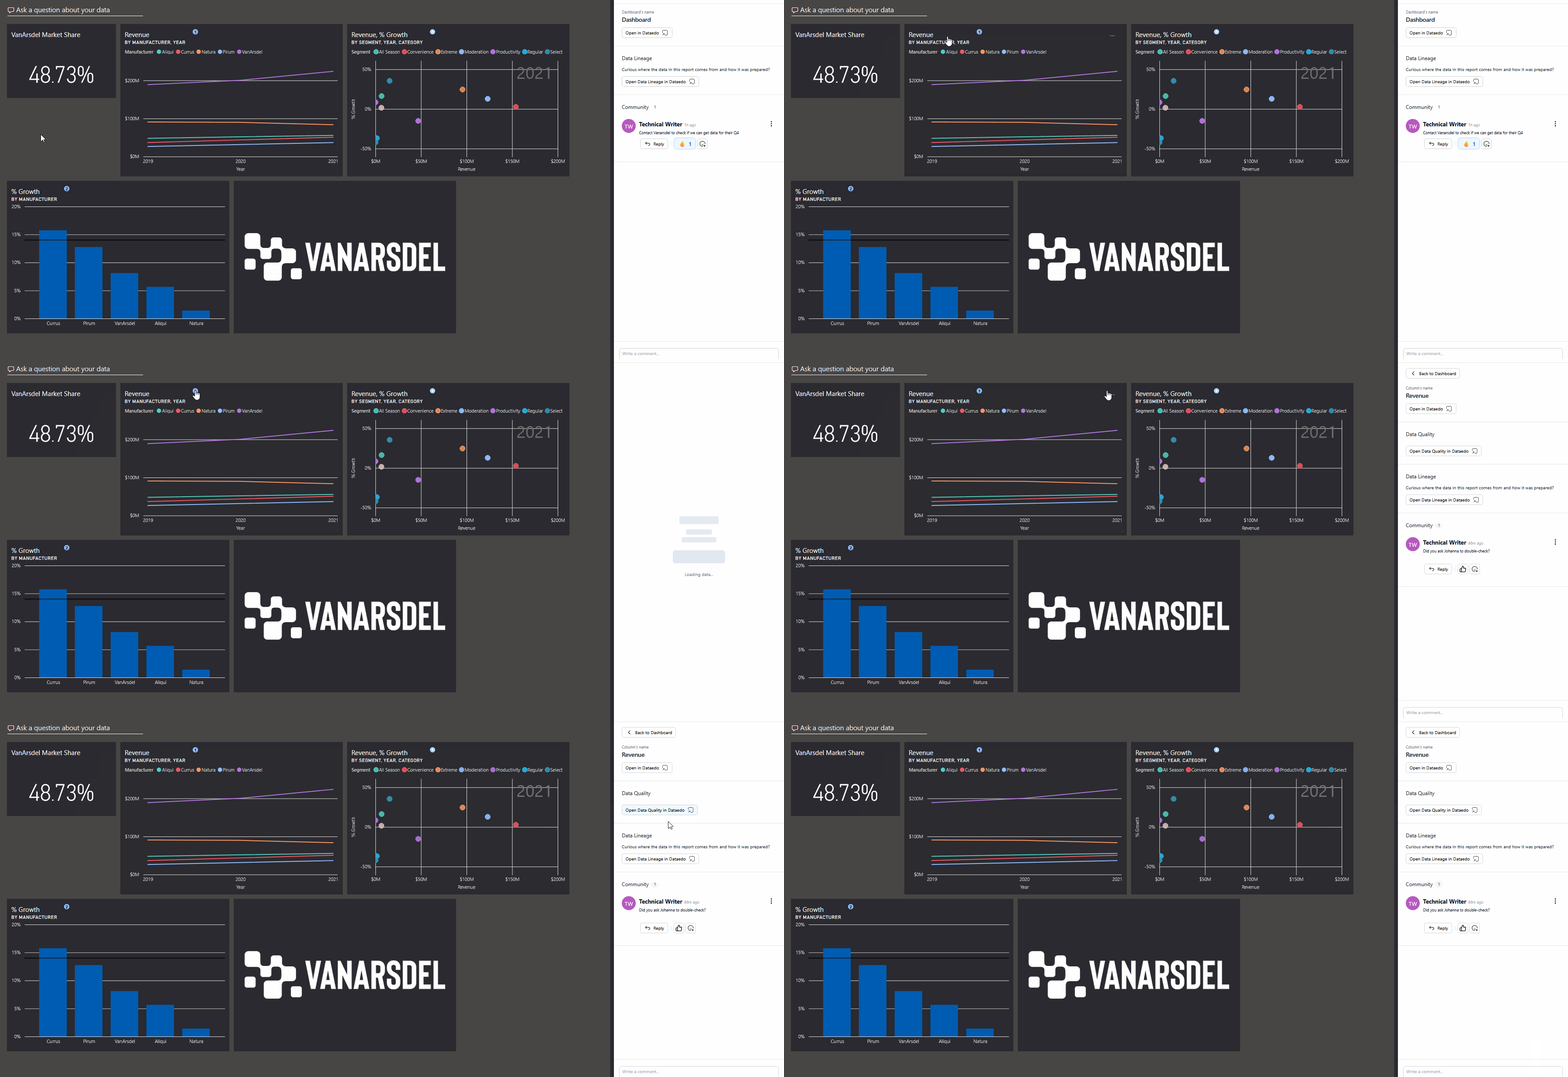
Execution Flows
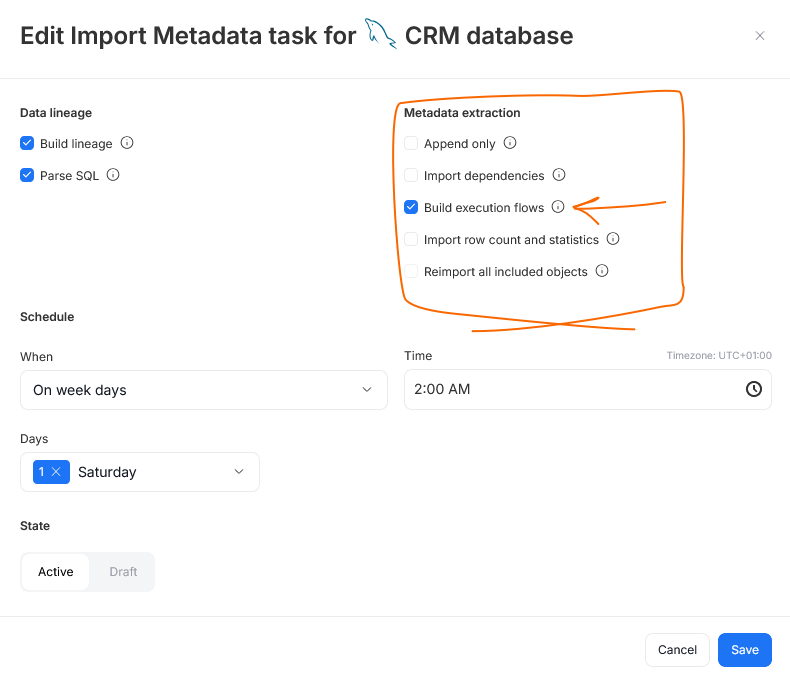
Dataedo 26.3 introduces Execution Flows — interactive diagrams that visualize the logic of a stored procedure, function, or ETL pipeline, so you can understand how it executes at a glance. For database routines, the flow is built automatically during Metadata Import using Dataedo's built-in SQL Parser; for ETL pipelines, it is built from the structure of the pipeline itself.
You can enable this feature by checking the Build execution flows option when scheduling a Metadata Import.
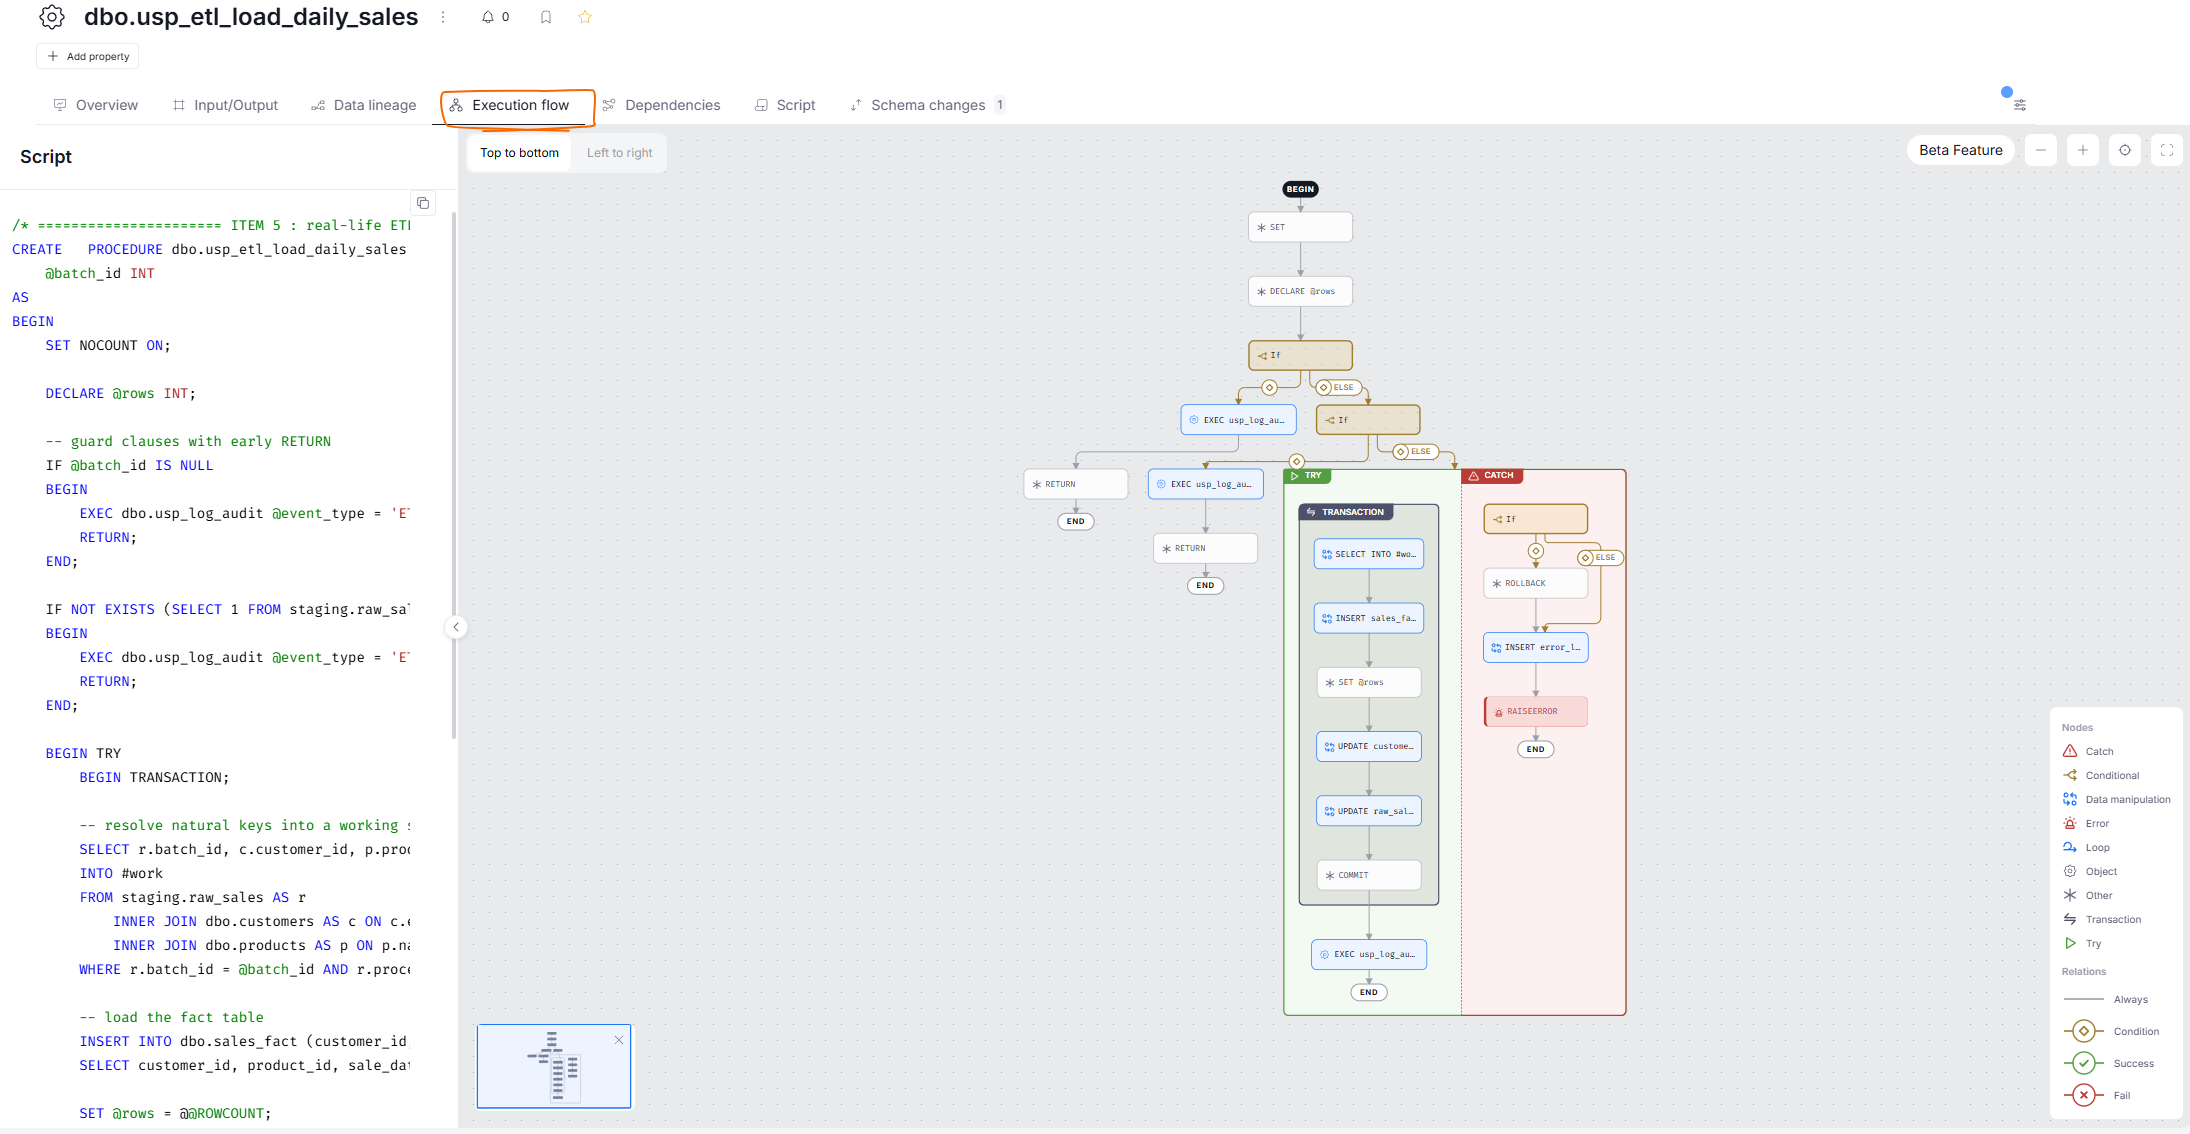
Once imported, an object's Execution flow tab shows its diagram, from the BEGIN marker down to its END markers.
Multiple Agents
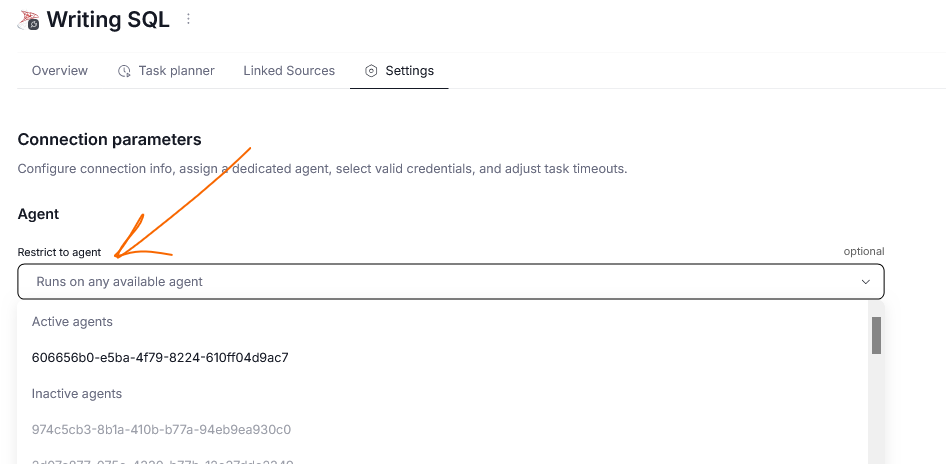
Starting from version 26.3, you can now have multiple agents running in your repository. You can assign a specific Agent to a Connection, so that only that Agent processes its tasks. This is useful when some data sources require extra permissions or limited accessibility — rather than granting every Agent the full scope needed to reach every source, you can run a separate Agent with elevated permissions dedicated to that source.
You can make the assignment when first scheduling tasks for a source during Metadata Import, or later under Connectors > Connections. Connections left unassigned are picked up by any free Agent that has the Process tasks without an assigned agent option enabled.
Documenting JSON fields
Dataedo can now parse and document the internal structure of JSON columns from SQL Server and PostgreSQL. Enable the Import JSON structure checkbox when scheduling a Metadata Import to extract a JSON column's nested keys and values. Extracted JSONs can be viewed on a grid in the object's columns section.
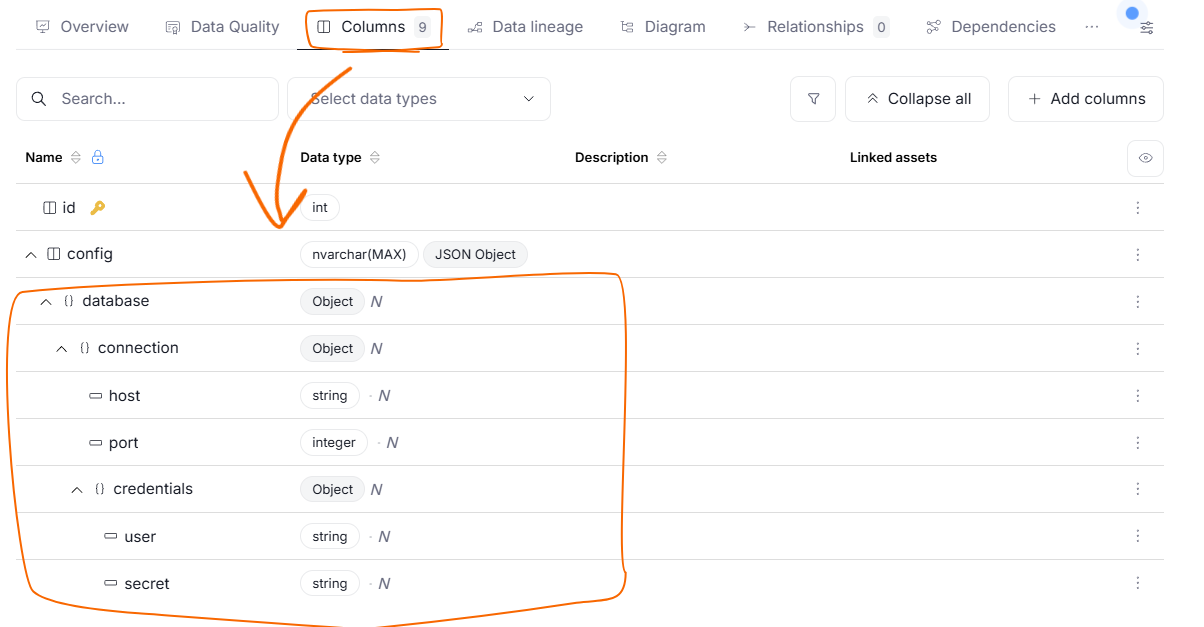
Nested columns can be documented just like any other column, and are marked with badges (JSON Object, JSON Array, Object, Array) so you can tell them apart from regular columns.
Note that JSON detection relies on Data Profiling, so JSON structure will not be picked up on a source's first Metadata Import. Learn more here.
Metadata Import filtering improvements
From this version on, you will see a new tab when importing metadata from Power BI Report Server, SSRS, and Tableau: Filter by Folders. Dataedo can now take advantage of these sources' folder structure — you can select which folders to import, and combine that selection with Advanced Filters using the convert to advanced filters button.
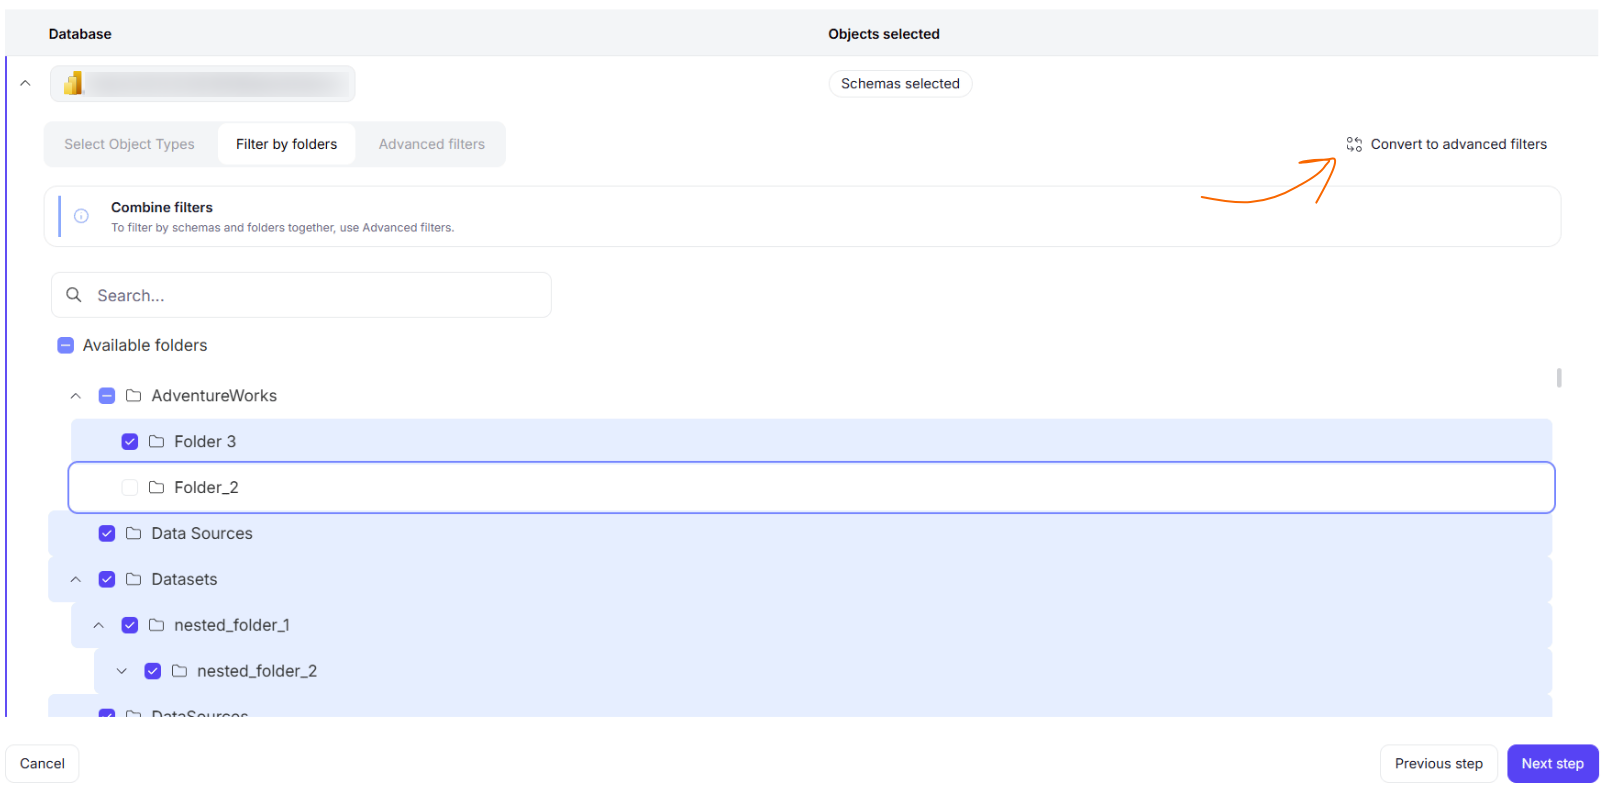
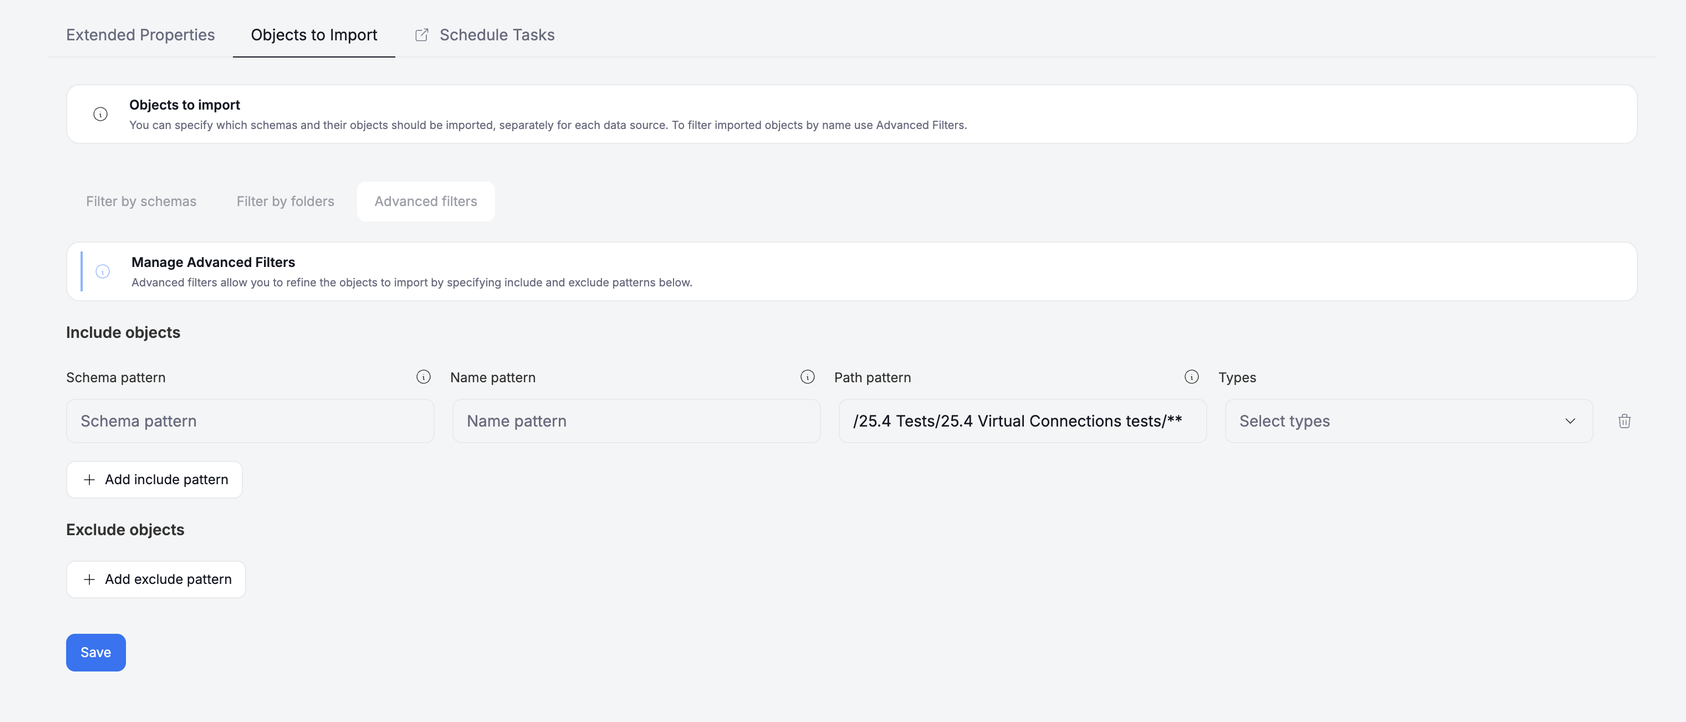
Additionally, Advanced Filters for all connectors now accept a glob pattern via the Path Pattern option, letting you combine them with folder-based filtering.
Changes to permissions management
Previously, admins could assign permissions to users using two modalities — either via shared User Groups or by assigning roles to a user individually from their account.
While allowing for greater flexibility, this system proved confusing for many users and led to issues when rearranging users' permissions. As such, we decided to rework how permissions are granted.
Starting from Dataedo 26.3, user roles can be assigned using User Groups only. This makes it so that all permissions are stored in one place, and can be quickly edited and kept aligned with your current company policy.
All permissions currently assigned to individual users will be automatically migrated to User Groups. Since this migration can create a large number of single-purpose groups. As an admin, you should take extra time after the update to review those changes and clean up your group structure.
Community rework
Version 26.3 brings changes to the Community module. First, Community has been moved from a side panel view to its own section at the bottom of an asset's page.
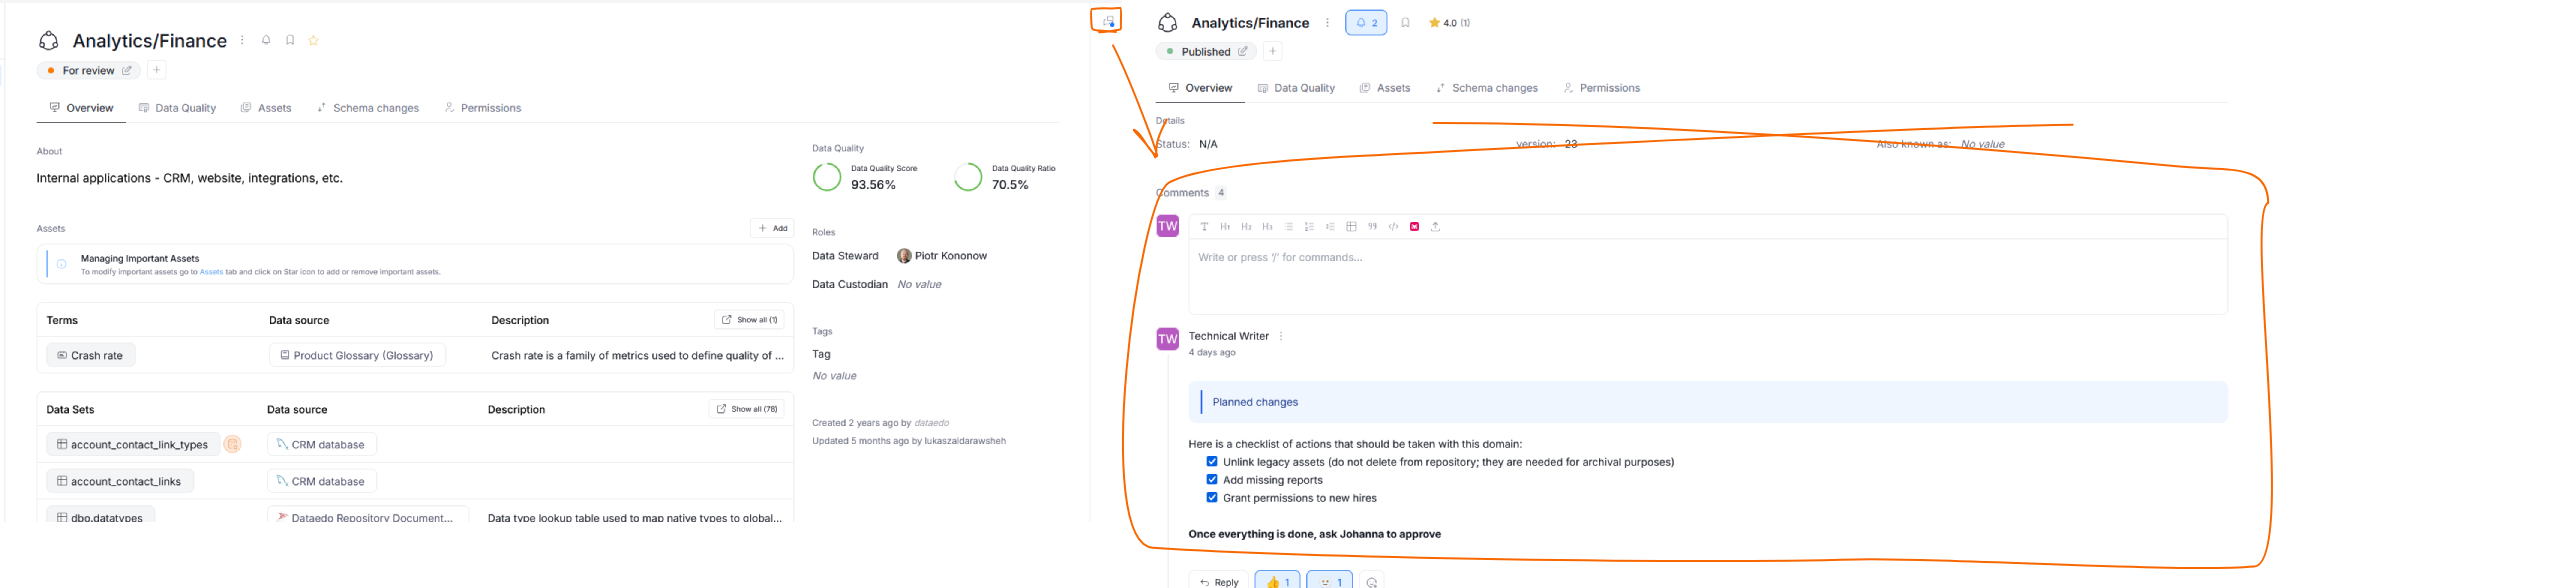
In this new version of Community, you can leave comments using our rich text editor — the same one used for descriptions. This means that comments now support photos, code snippets, markdown syntax, diagrams, and more.

The move to a new text editor also means that some functions are being retired. You can no longer set a comment's status as a "TODO" or a "WARNING". Existing TODO and WARNING comments will be converted to regular comments, with a special banner at the top.
You can now also leave likes and emoticon reactions under comments.
Learn more in our dedicated Community article.
Configurable task timeouts
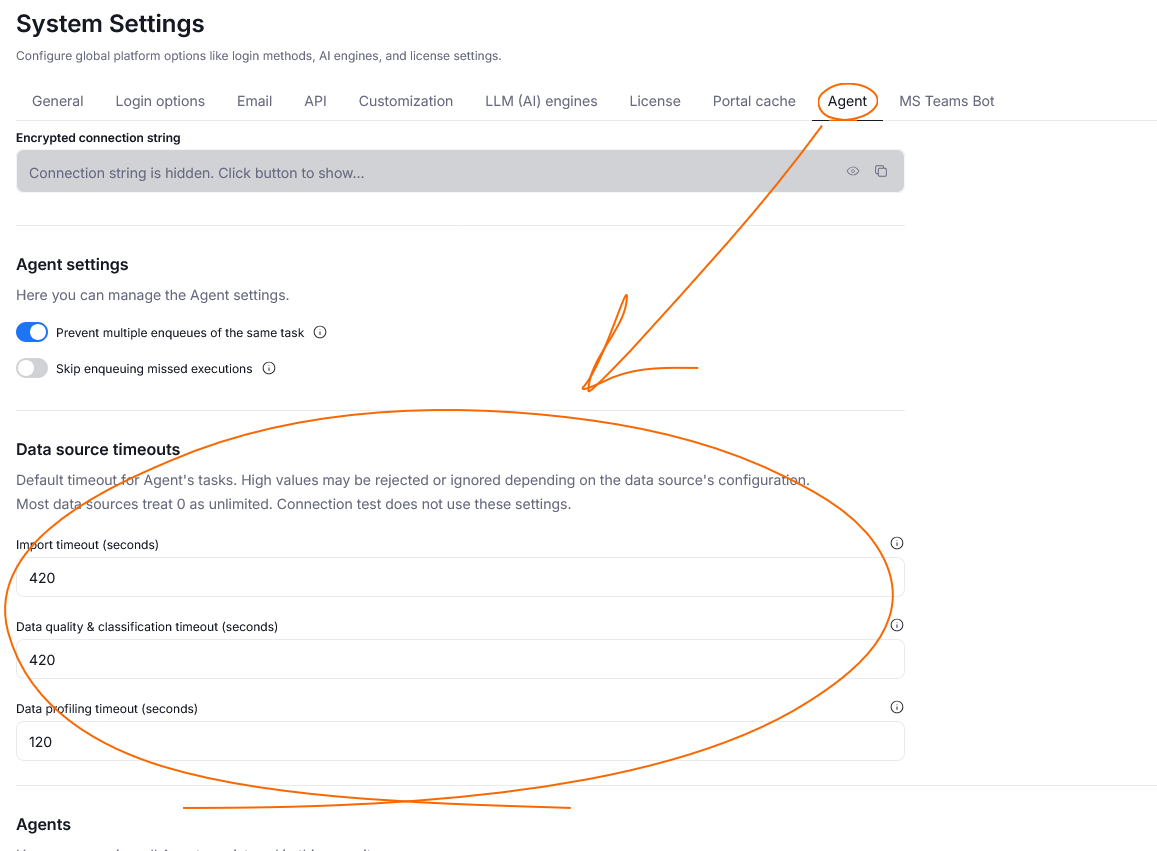
Tasks executed by the Dataedo Agent (imports, Data Quality & Classification, and Data Profiling) now have configurable timeouts — a maximum execution time after which a task is aborted if it has not finished, so a stuck task can no longer hold up the rest of the queue.
Admins can change the global default timeouts in Portal, under Settings > System Settings > Agent, or directly in the repository via dbo.configuration.
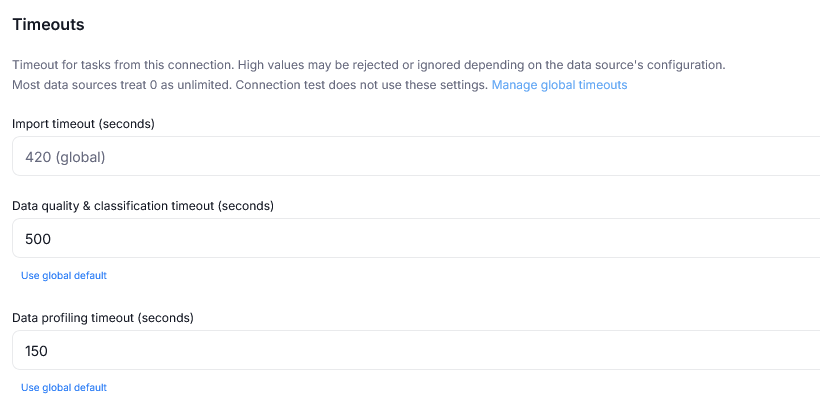
You can also override these values per connection. Open a data source under Connectors > Connections, go to its Settings tab, and edit the timeout values for that source specifically — these override the global defaults.
Description synchronization added to Metadata Sync
Metadata Sync now also supports two-way synchronization of table and column descriptions between your data source and Dataedo. Descriptions are synchronized as Markdown, so some rich-text formatting used in Dataedo (such as images, banners, or merged table cells) cannot always be represented in the source; Dataedo flags such descriptions and helps you resolve the formatting before export.
This also changes the Metadata Sync configuration tab in the scheduler, with a new view that lets you customize both Description and Classification sync logic for different asset types in your source.
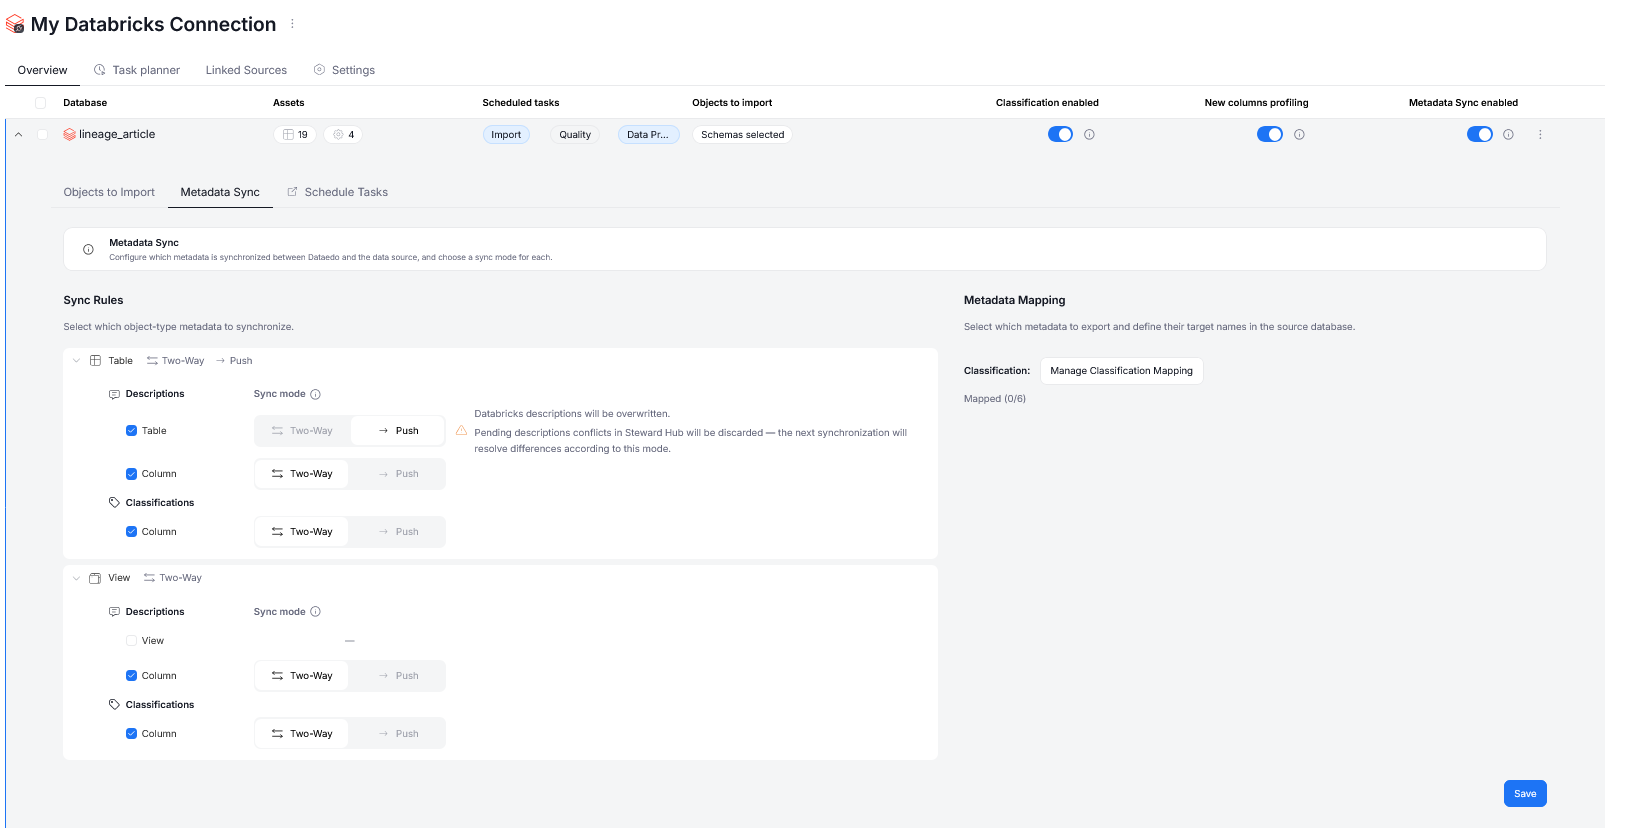
This change also comes with the change to sync mode: the previous three-way distinction (Manual, Take Dataedo, Take Source), got replaced with a binary Two-way and Push choice. Two-Way synchronization requires you to resolve any synchronization conflicts in Steward Hub, while Push synchronization always automatically propagates changes made in Dataedo.
Existing configurations using Take Source or Take Dataedo are migrated to Two-Way on upgrade
Data Quality Rule Instances
You can now add Custom Fields to a new object type — Data Quality Rule Instances.
Custom Fields
Pinning
From this version onwards, you can choose to pin important Custom Fields. You can do this in Dataedo's settings.
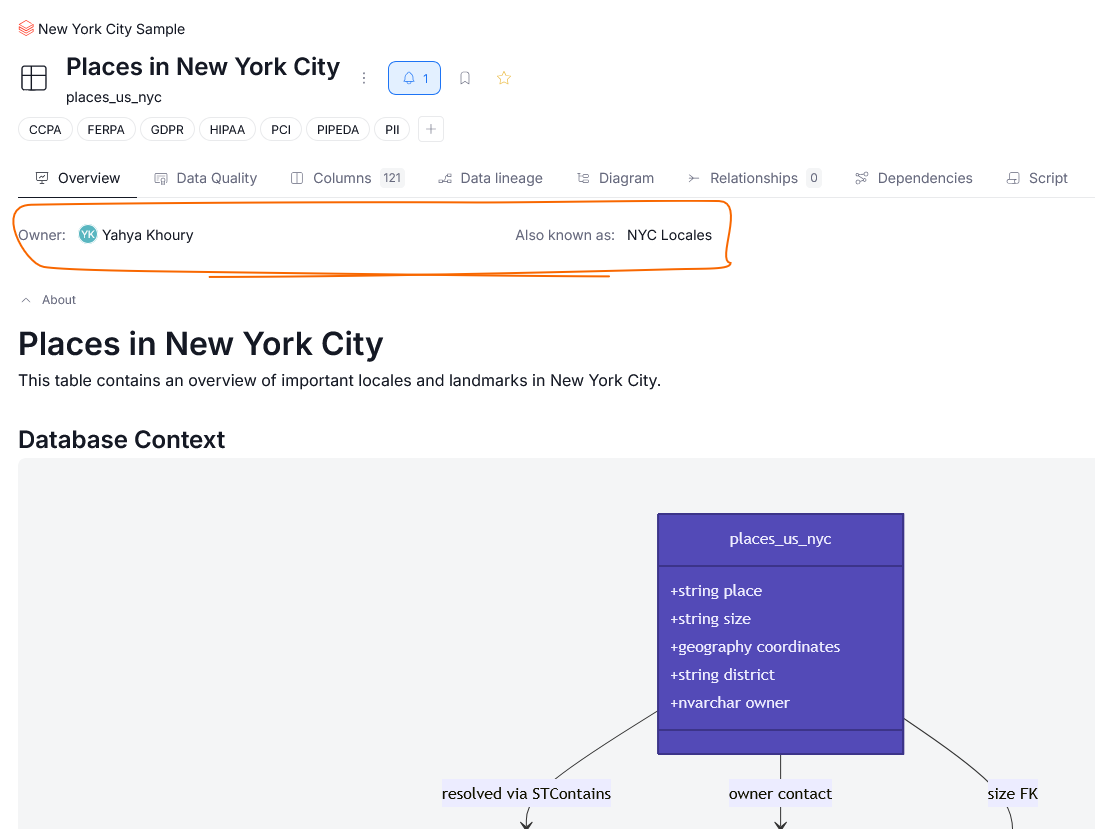
Pinned Custom Fields appear at the top of the asset page, above the description, and are the first thing you see when you open the page.
Additionally, Custom Fields that have previously been displayed on the side of the page (Owner, Tags) will be migrated as Pinned Custom Fields — they will be moved to the top of the page with the rest of the Pinned Custom Fields. You can choose to unpin them, but then they will move to a lower position with the other Custom Fields.
When you add a new Custom Field, it will not be pinned by default.
Multi-User Custom Fields
This version changes how User Custom Fields work. From now on, any Custom Field of the User Type can accept an unlimited number of users (as opposed to the previous behavior, where each Custom Field could take exactly one user). This means that a single object can have multiple Owners, Data Custodians, etc. assigned to it.
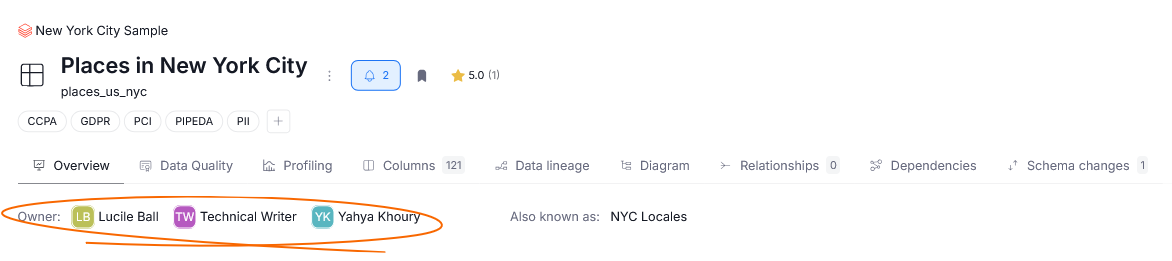
User activity and responsibilities
You can now view user activity and responsibilities in the Portal overview. You can view this for your own profile and your coworkers'.
The Activity tab shows a grid of the user's activity over the last 12 months — the darker a tile, the more activities took place that day — along with a list of recent activities. You can filter by activity type, or click a tile to see only activities from that date.
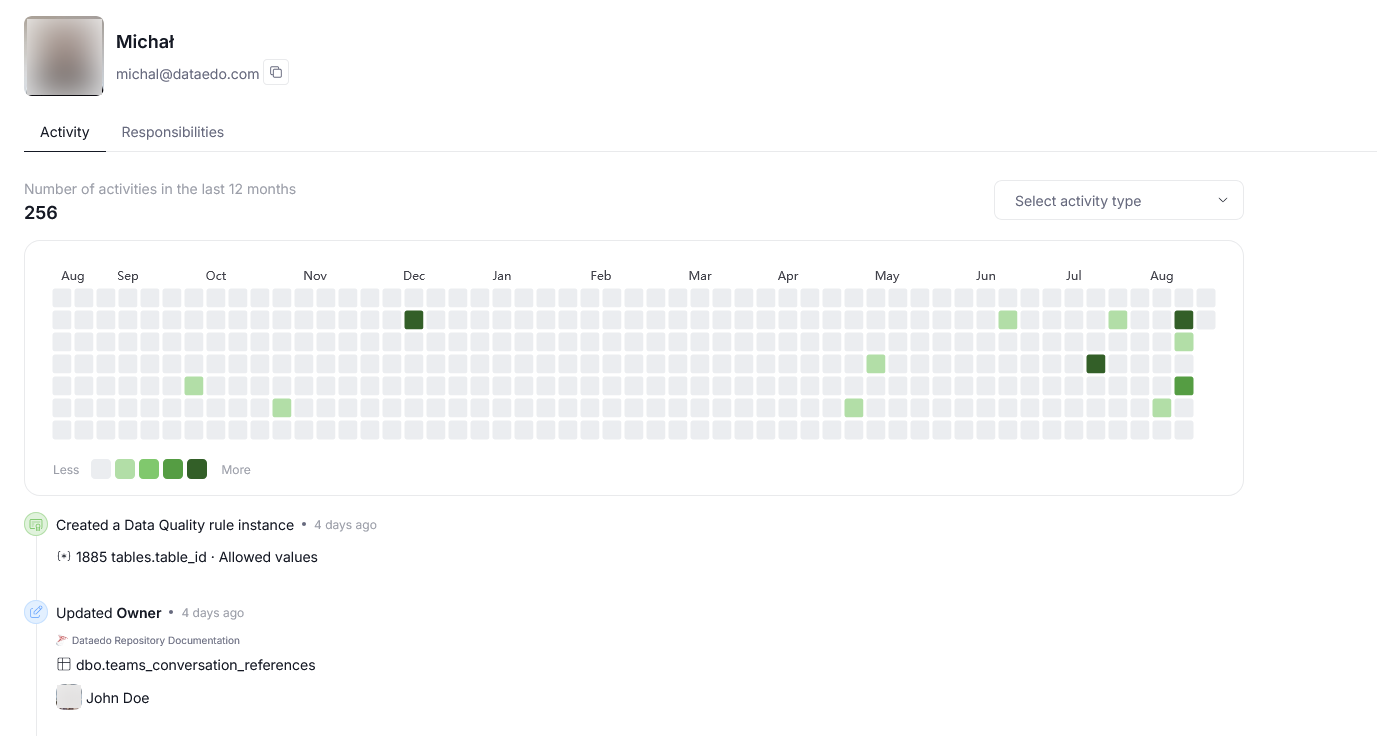
Note that permissions still apply: if a user worked on an asset you cannot view, you will see that they performed some action, but not what asset or activity it was.
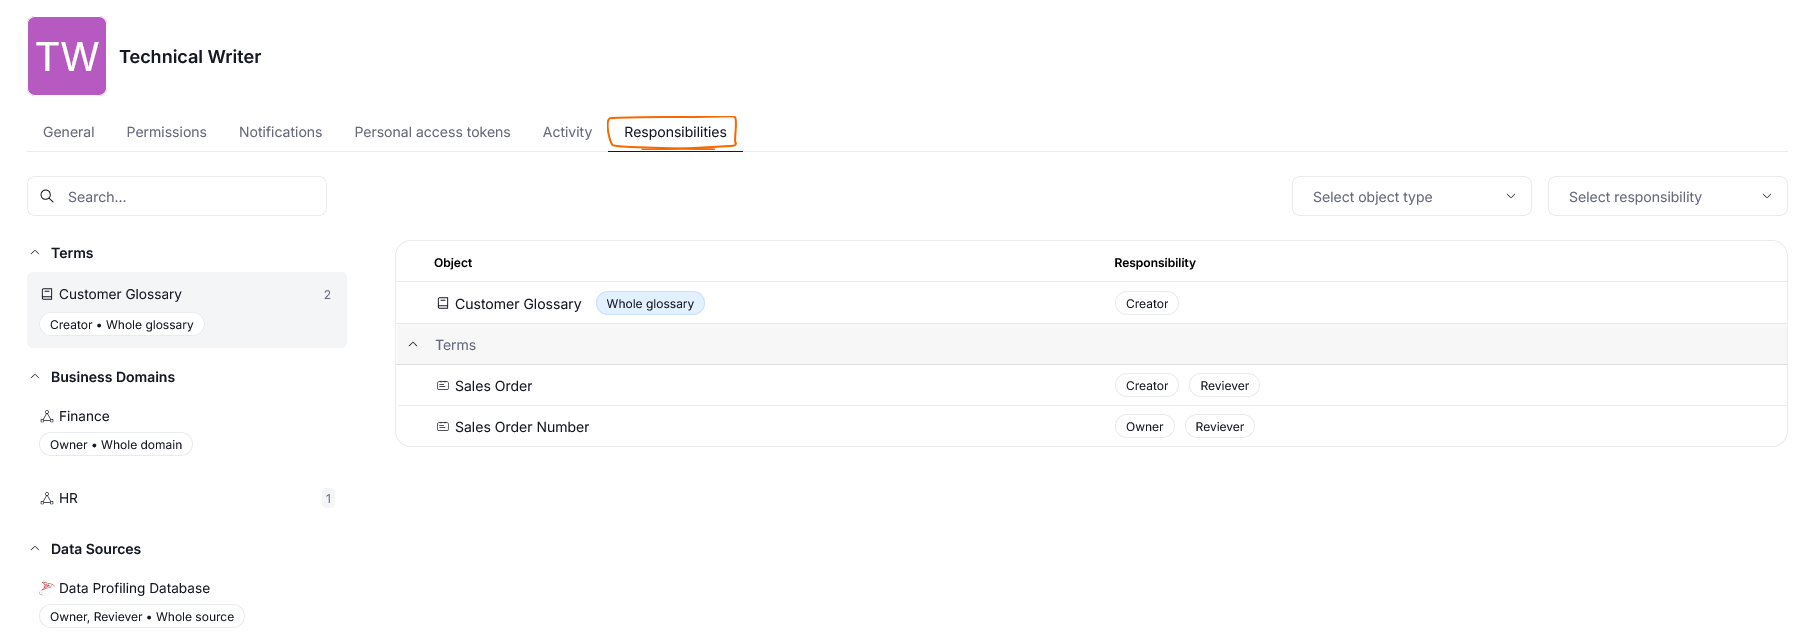
The Responsibilities tab shows assets where the user holds a role — Owner, Reviewer, Data Custodian, or another role from your organization — generated from User-type Custom Fields. Assets are grouped by type on the left; selecting a type shows the relevant assets on the right.
Single-block Overview layout
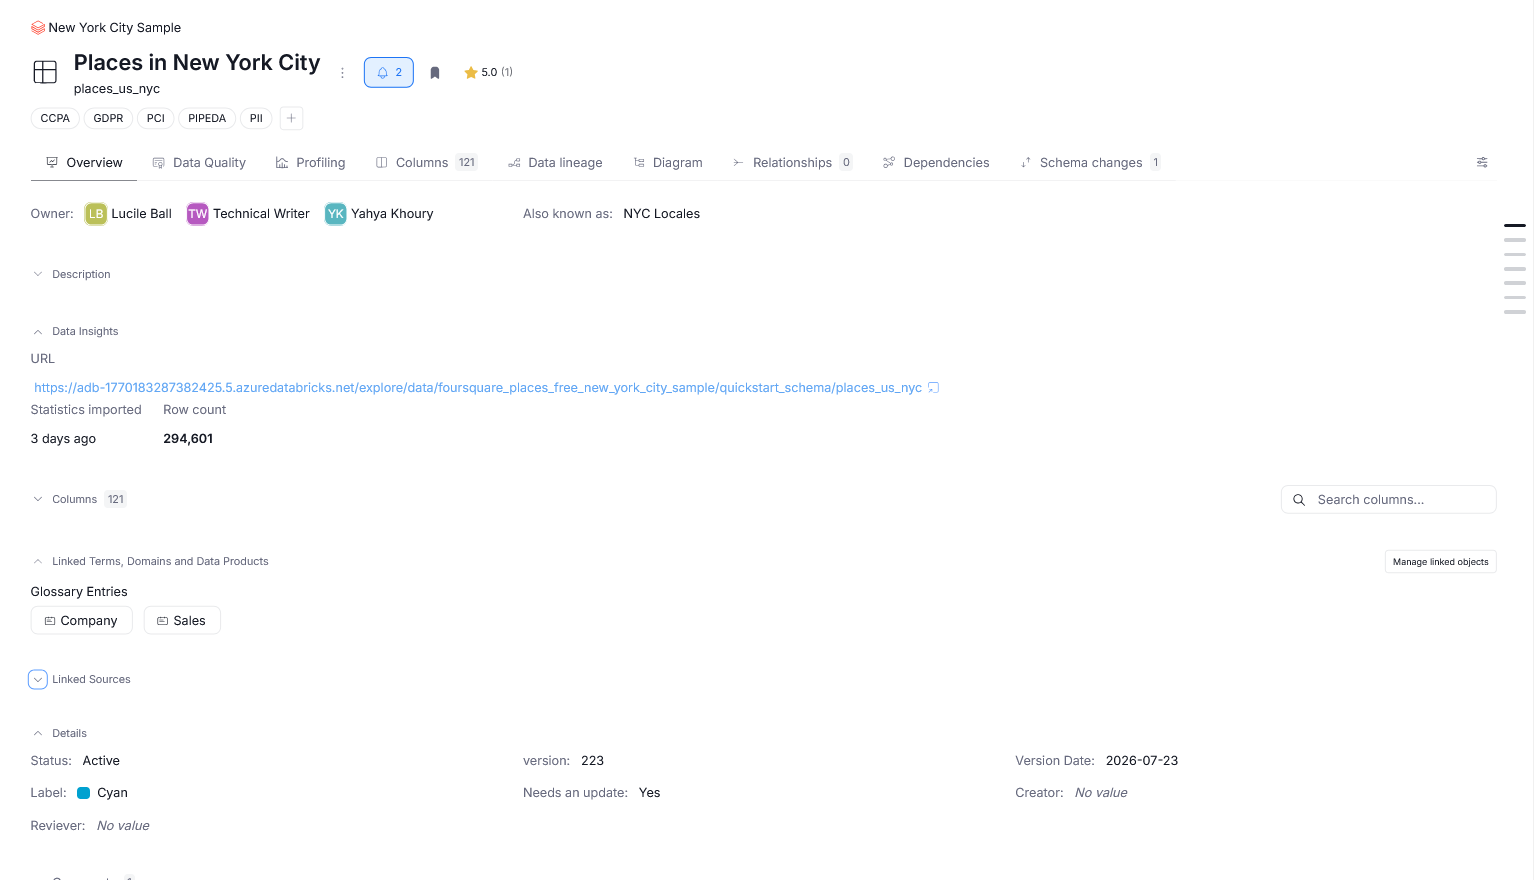
Object Overview pages now use a single block layout. Data Quality score and ratio moved to the page header, and Custom Fields are now in a Details section, which also lists database properties. Column lookups got their own dedicated section. Metadata moved to the bottom of the page below Comments, while Statistics and other data insights were moved to a new Data Insights section. All sections are collapsible.
Connectors coming to Portal
With version 26.3, we continued bringing connectors you already know from Desktop over to Portal, allowing you to perform all data actions in one place.
The connectors added to Portal are:
- IBM Db2
- IBM Db2 on Cloud
- IBM Db2 Big SQL
- Apache Hive Metastore (on Azure SQL, MariaDB, MySQL, PostgreSQL, and SQL Server)
- Azure Cosmos DB (MongoDB API)
- Amazon DocumentDB
- Salesforce
- Google BigQuery
- Copy & paste import, for both databases and reporting sources
- SAP ASE (Sybase)
- SAP BusinessObjects
- Astra DB
- Amazon Athena
- Amazon Aurora PostgreSQL
- Azure Data Factory
- Azure Synapse Pipelines
- Coalesce
- Microsoft Dataverse
- Microsoft Dynamics 365 with Dataverse
- dbt
- Elasticsearch
- Hevo
- SharePoint Lists
- Analysis Services Tabular (Azure and SQL Server)
- Analysis Services Multidimensional
- Vertica
- Importing metadata from DDL scripts
- Connecting to a database with ODBC
- Importing OpenAPI/Swagger documentation
OAuth authentication for Databricks
Dataedo can now connect to Databricks using OAuth, in addition to the existing Personal Access Token method. Learn more here.
OIDC authentication
Dataedo 26.3 adds a new authentication option. Now you can configure logging in via OIDC. Learn more here.
UI & UX changes
Rich text for column descriptions
Column descriptions now support rich text, without photos — so you can use banners, bolding, italics, and other formatting also available for other descriptions. Descriptions are still shown as plain text when viewing columns en masse on grids; open a column's asset page to see the full formatted description.
Wider pages and grids
Pages are now aligned to the left instead of centered, with grid- and card-based pages spanning the full screen width and other pages capped at 2000px. The homepage, 404 page, and offline page remain centered.
Remember visited tab
When navigating between objects of the same type (e.g. one column to another), Dataedo will stay on the same tab. So for example, if you have a Columns tab open in Table_a1, and you navigate to Table-b2, that second table will load with its Columns tab open, instead of the Overview.
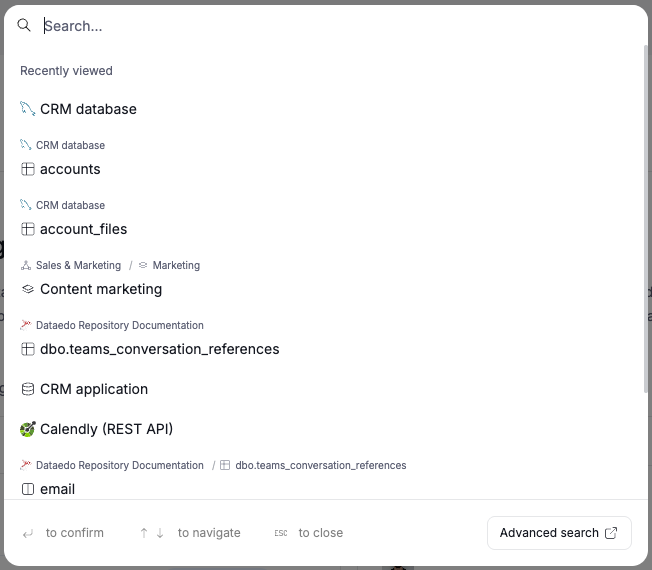
Recently visited objects in search
Recently viewed objects are now shown in Quick Search and Advanced Search as well.
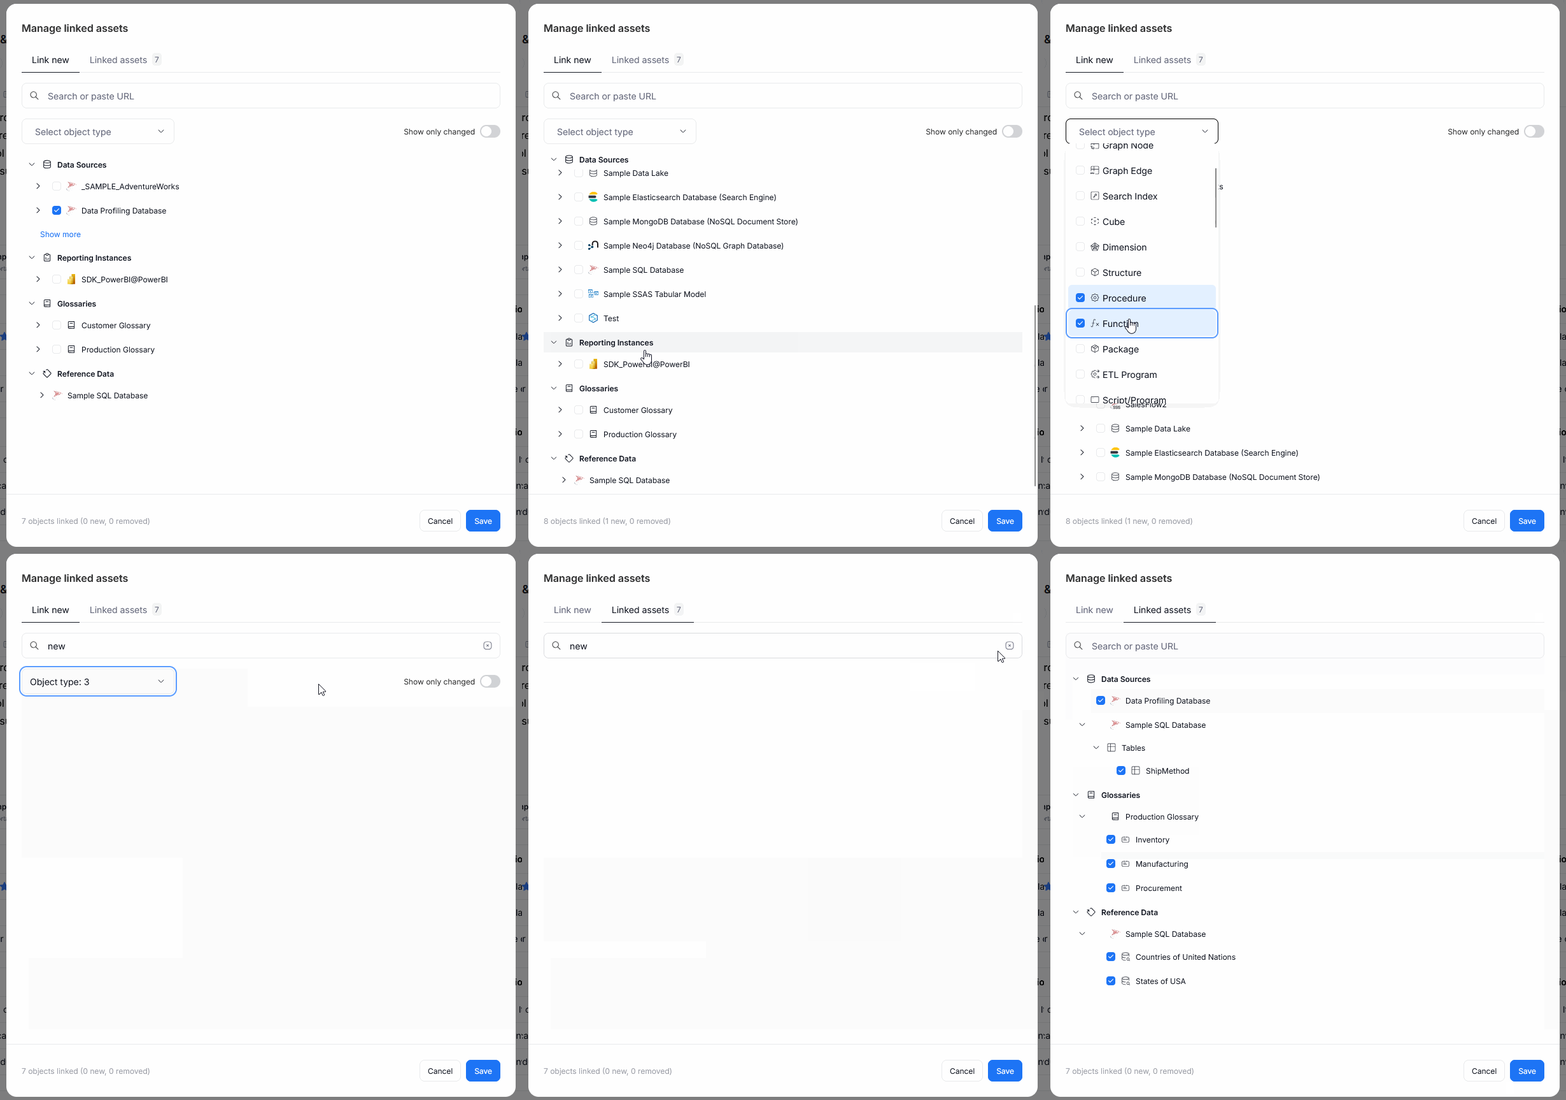
Redesigned linking popup for Domains
We redesigned the popup used to link objects to a Domain for easier navigation.
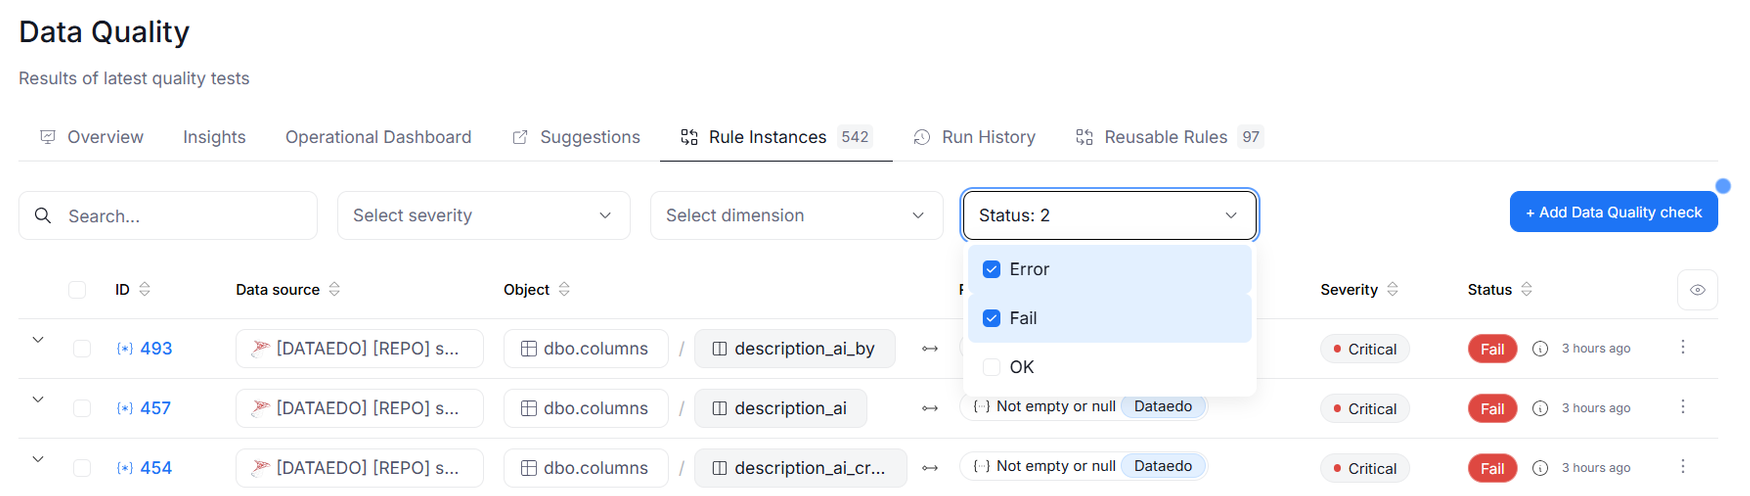
Multiple choice status filter on Data Quality grids
The Status filter on Data Quality grids is now multiple choice, so you can filter by several statuses (e.g. Warning and Error) at once instead of checking each list separately. Severity and Dimension filters also gained multi-select, and the selected filters are reflected in the URL.
Data Quality Overview page filters
We added new filters to the Data Quality Overview. You can now also limit the displayed data by:
- Owner
- Domains and areas
- Date range
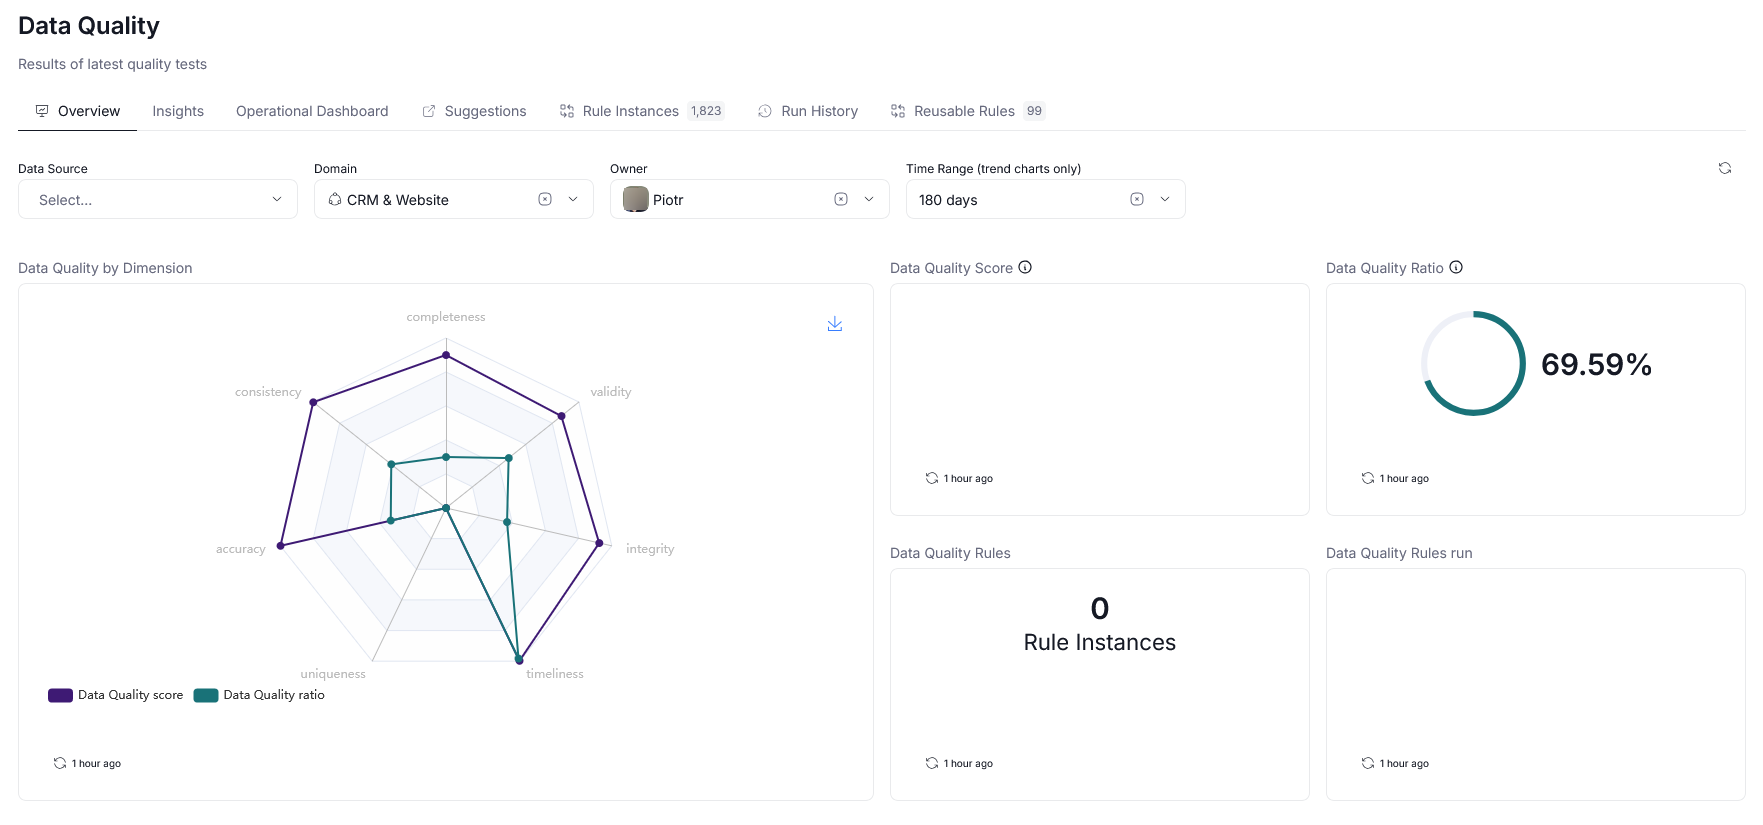
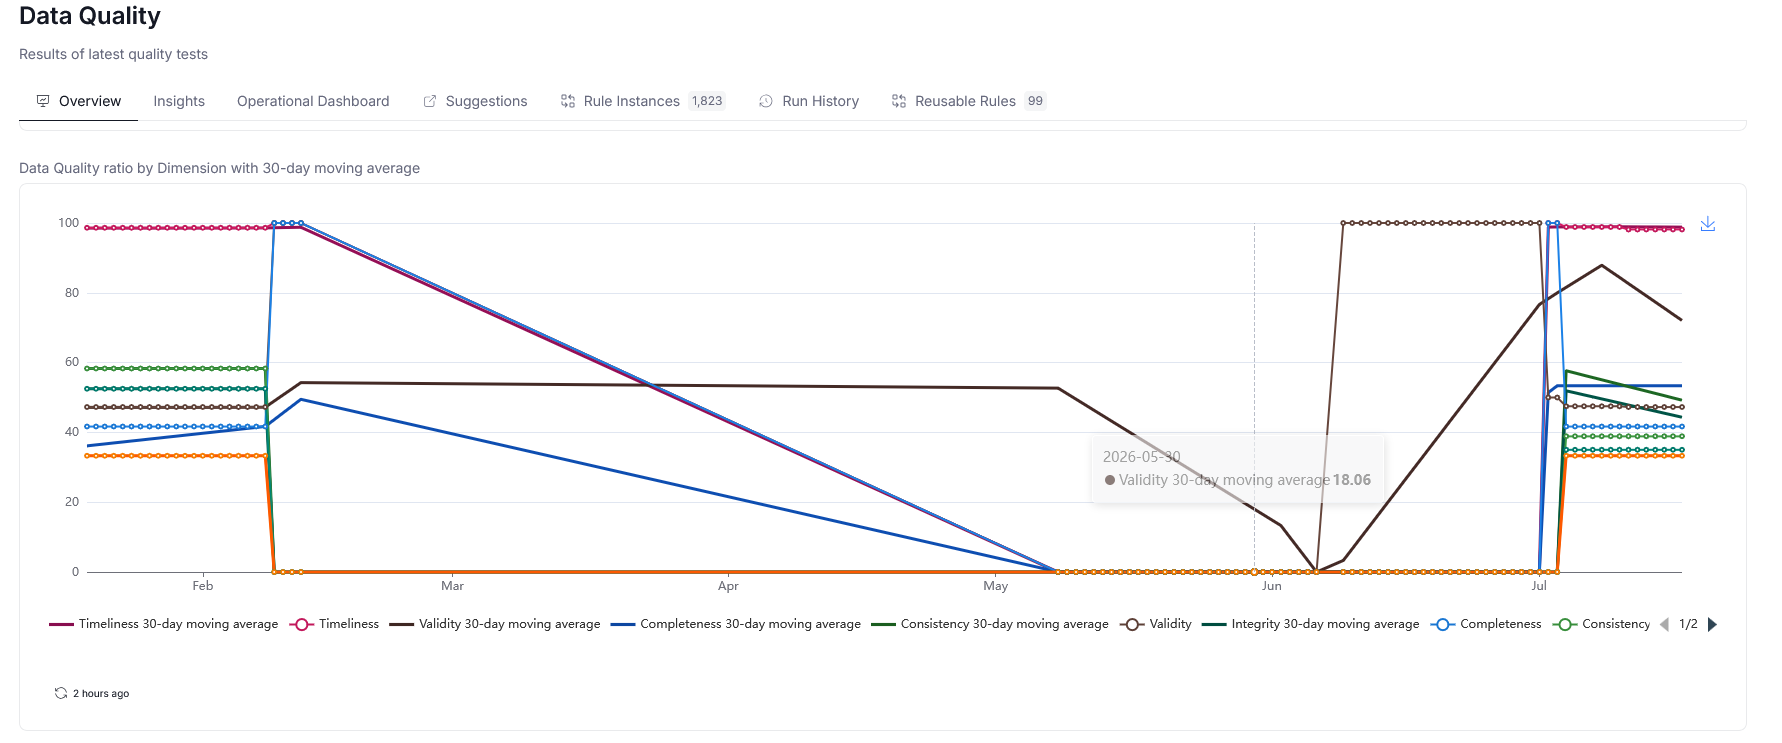
Data Quality ratio widgets received an overhaul, with 30-day moving averages added.
Linked Sources improvements
Version 26.3 brings a range of improvements to Linked Sources, making them easier to use.
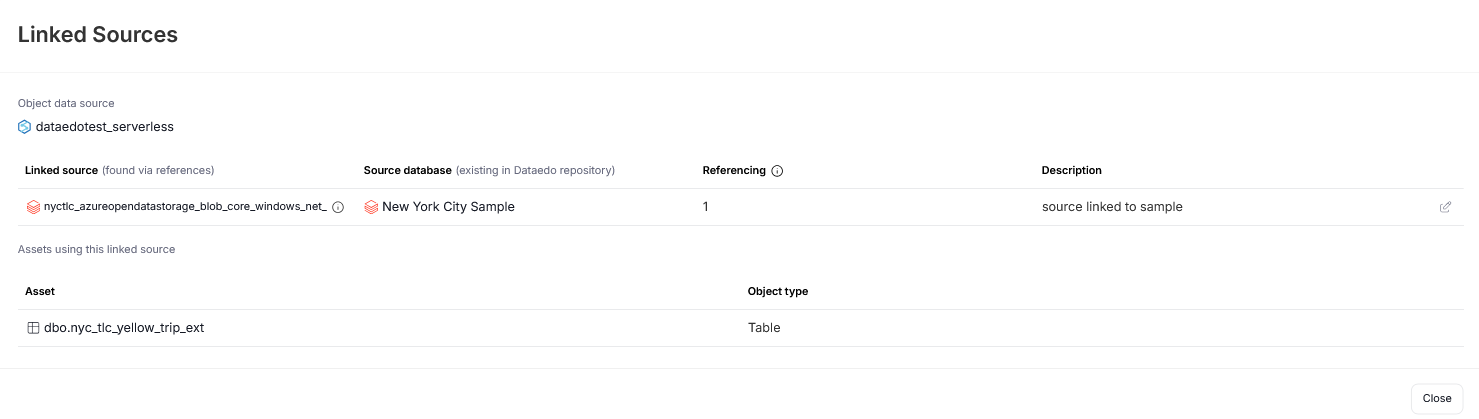
A Linked Source connection now has its own details page, listing every object that uses it.
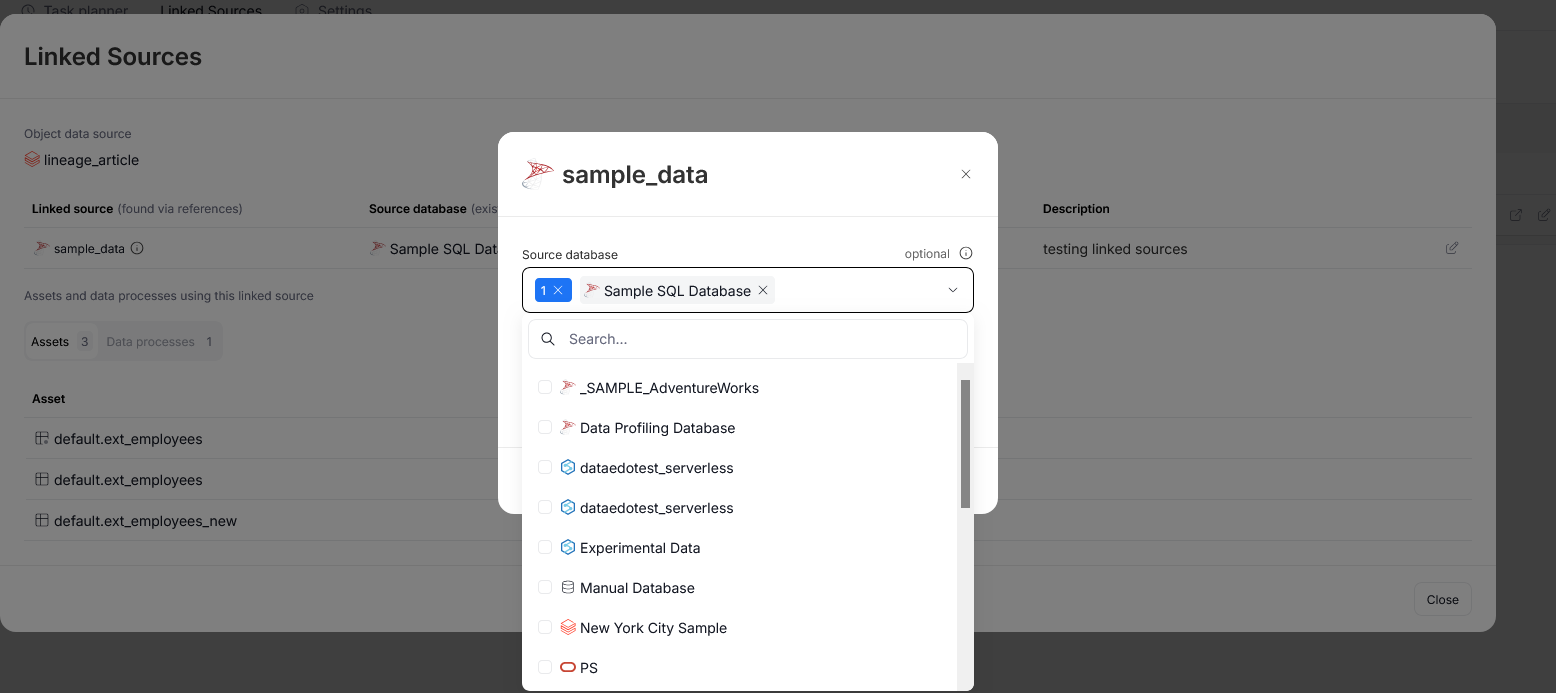
You can also assign a Linked Source directly to an object, using a dropdown selection, instead of managing assignments only from the connection's Linked Sources tab.
Finally, (Power) Data Stewards can now view and edit an object's Linked Source directly from its Overview page, instead of going through the connection's Linked Sources tab.

Display connection on a data source's Overview
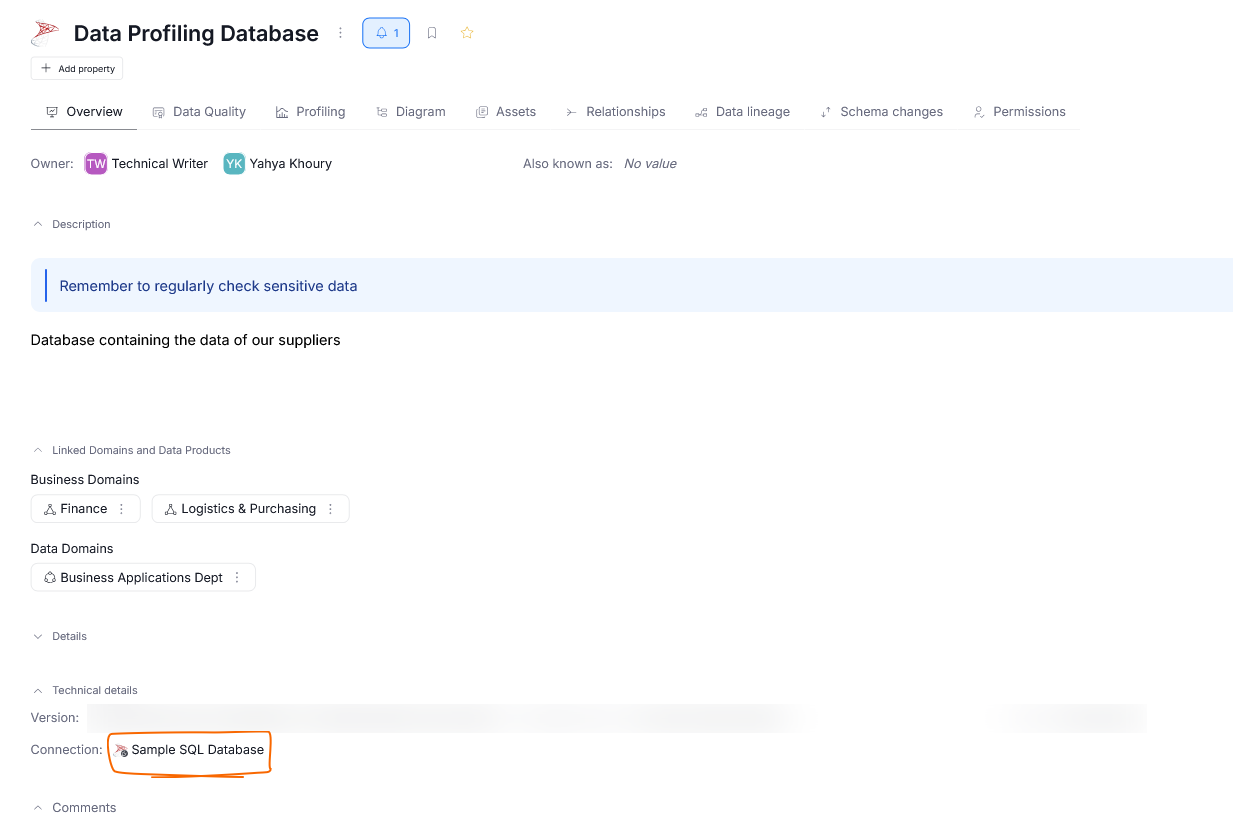
A data source's or reporting instance's Overview now shows a clickable tag linking to its Connection in the Technical Details section, making it easier to jump from an object to the Connection that supplies it. This tag is visible only to users with Connection Manager permissions.
Changes to Glossary term relationships
We revised the way in which term relationships are assigned. Now, all relationships can be added and modified in one place, directly in the term's Overview.
We also added a neat relationship diagram that helps you visualize dependencies in your Glossary.
Glossary dashboard
We added new widgets to the Glossary dashboard to help you track Glossary adoption across your organization. These include:
- Glossary growth over time — a time chart showing how the number of Glossary entries changes over time.
- Detailed statistics of Glossary entries, alongside breakdowns of entries by type and by Glossary.
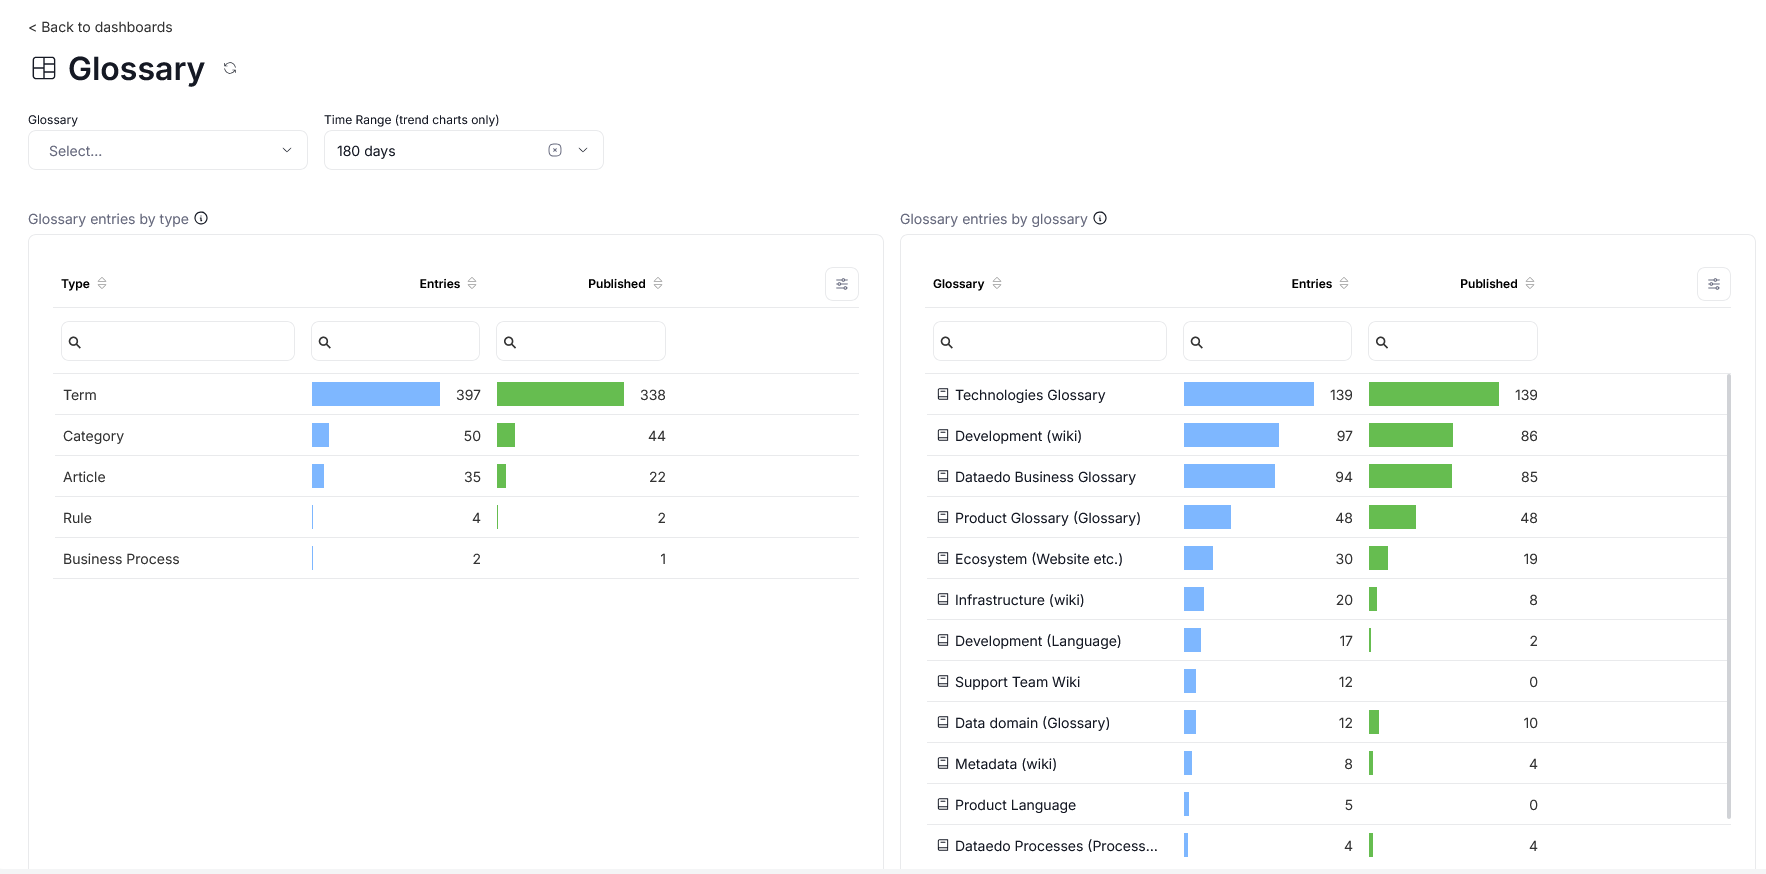
All widgets can be filtered by Glossary, and time charts can additionally be filtered by date range. Users see data only for the Glossaries they have permission to view.
Redesigned object tags on grids
We redesigned tags and object paths displayed on grids. This change leaves more place on the grid itself for the object's name and path.
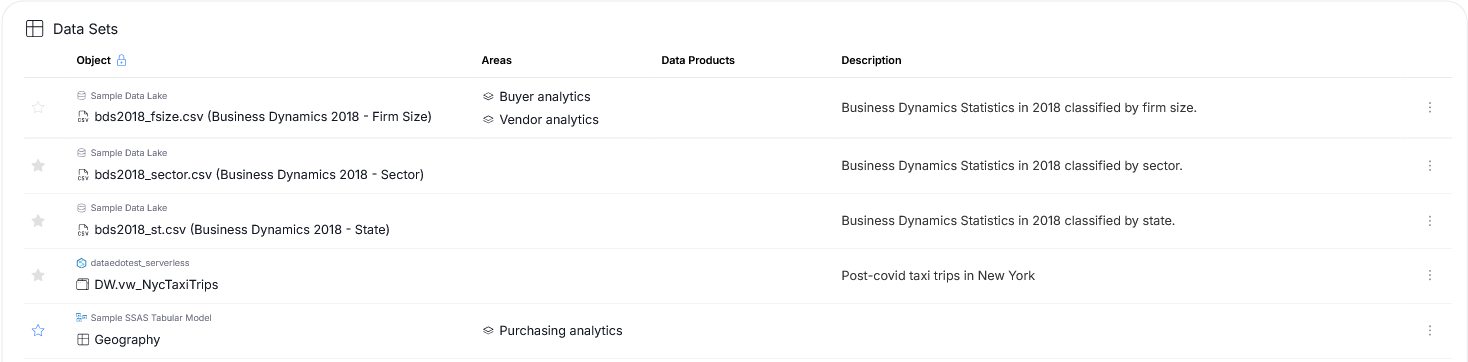
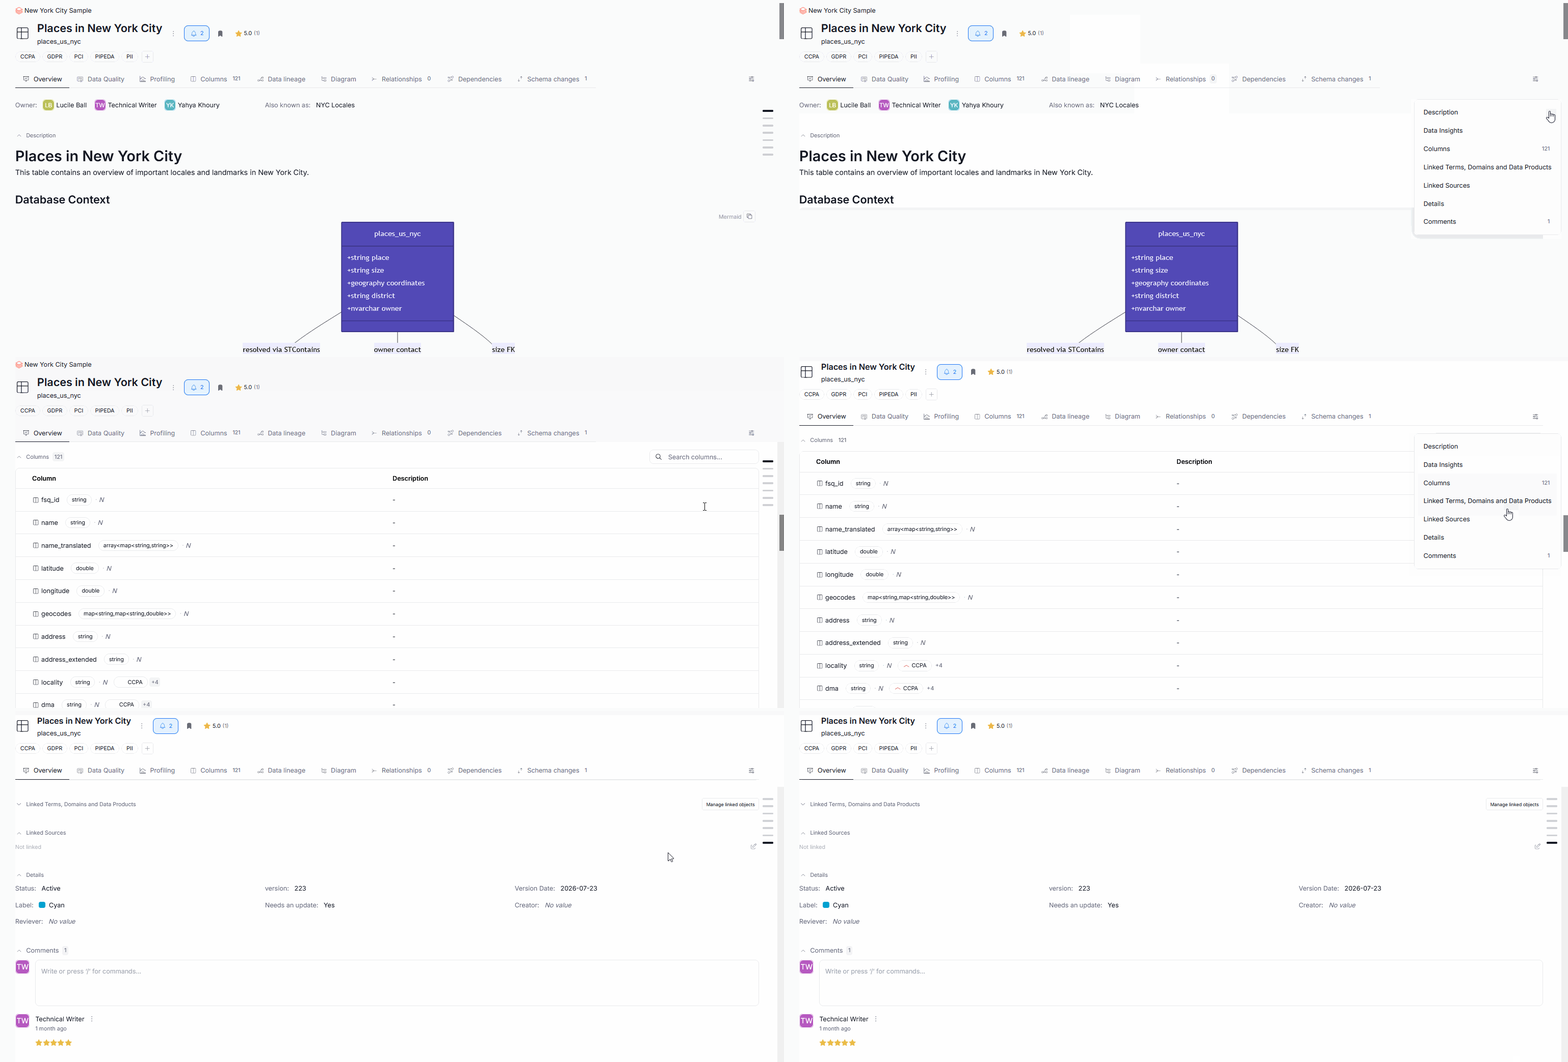
Table of contents on Overview pages
An object's Overview page now shows a table of contents as a set of horizontal slashes along the page's edge, which expands into a list of section names when hovered over. Clicking a name scrolls you straight to that section.
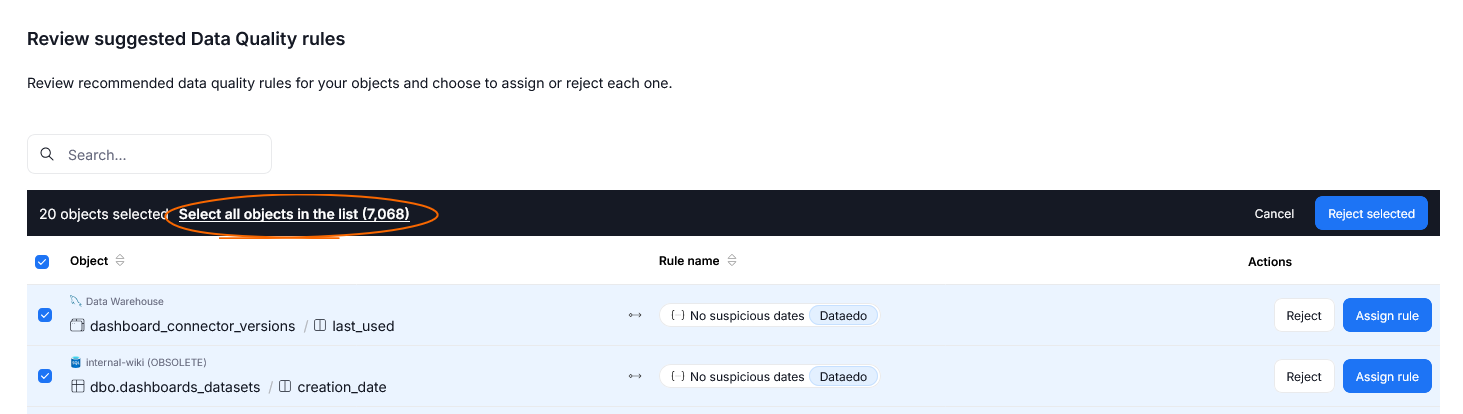
Select all objects across pages
When selecting columns on a grid, you will now see a Select all objects in the list button. Clicking it selects every object across all pages instead of just the current one. It is unavailable on a few grids with special constraints, such as ones mixing object types or nesting other grids.
Full columns list on Overview
The Columns section on an object's Overview now shows up to the first 200 columns (with a Load more button for the rest) in a two-column grid, instead of just the first five.
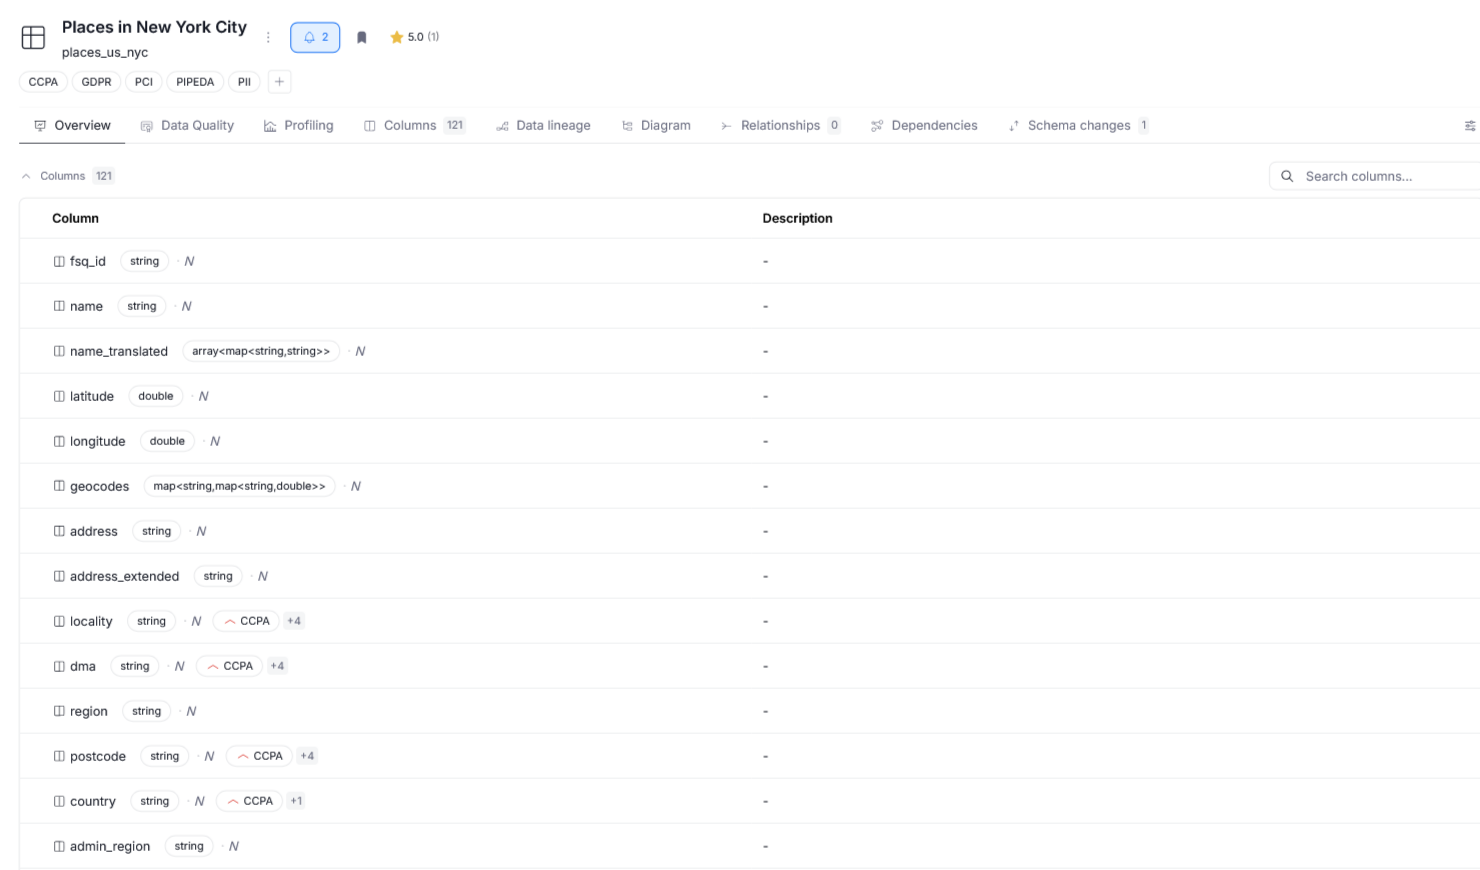
Text Editor
Version 26.3 brings two changes to the built-in rich text editor used in descriptions and Community.
First, in edit mode your browser's spell check engine can now check the correctness of the text you enter.
We also redesigned how mentions look: the height of a mention block now matches the height of the text, and we added a color distinction between mentions that relate to you and those that relate to other users in the organization.

Settings redesign
We refreshed the look of many tabs across Dataedo's settings to give them a cleaner, more minimal design, while still keeping their full functionality.
Other changes
Data Lineage fully moved to Portal
Version 26.3 marks the full transition of Data Lineage to Portal. This means that all Lineage views and features have been removed from Desktop.
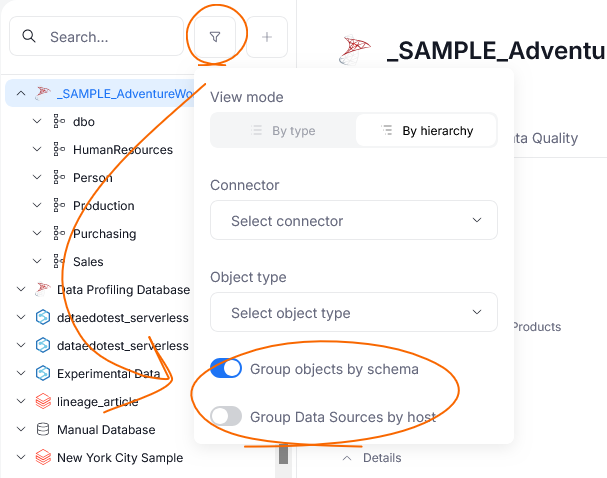
Grouping options in Data Sources
The Data Sources tree now offers two new grouping options: Group Data Sources by host and Group objects by schema. Grouping objects by schema displays each schema in the tree whenever a source contains more than one; expanding a schema then reveals folders for each object type. When grouping by host is enabled, data sources that share a host are gathered into a folder named after that host. Schema grouping is enabled by default, while you have to enable grouping by host manually. Both settings are saved in your browser's local storage, so they persist between sessions.
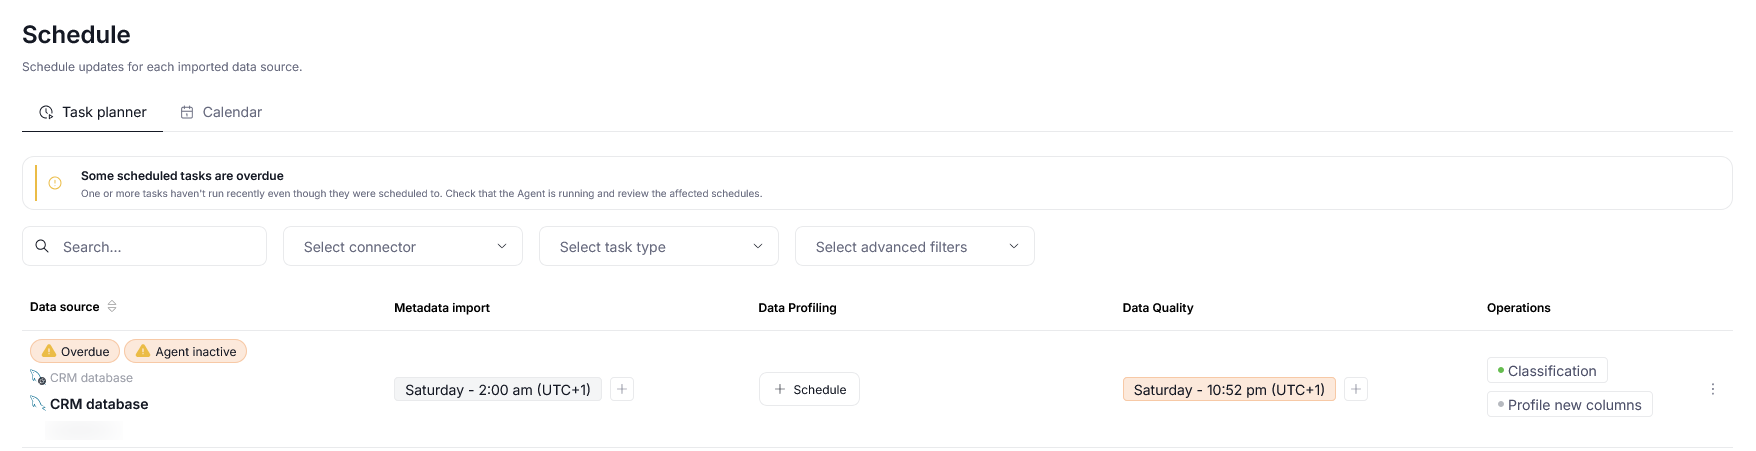
Overdue task warnings in Task Planner
Task Planner now warns when a scheduled task has not run even though its schedule says it should have. This can happen if an agent was offline during scheduled task execution. This warning appears as a top banner, a warning triangle next to the affected data source, and a warning on the specific task when its row is expanded.
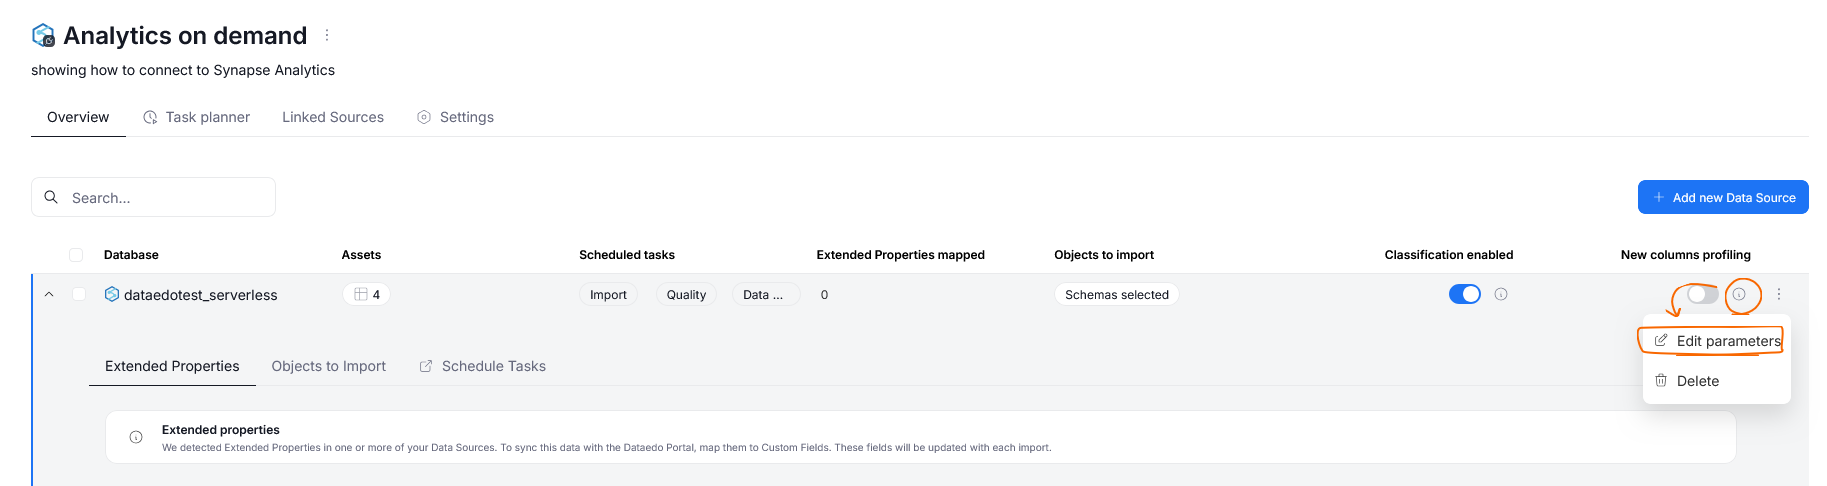
Change data source name
You can now use the Connection settings to rename a data source that supplies metadata to an existing asset using edit parameters. This is useful when you have renamed a source in your original database but want to preserve continuity of schema change tracking for the asset already documented in Dataedo.
Restricting allowed hosts
You can now configure the list of host names Dataedo Portal accepts on Docker and Windows (IIS) deployments, protecting against Host Header Injection attacks. Learn more here.
Connection details in the API
The data-sources/{id}/detailed API endpoint now returns a connection object with the host and port of the server the database runs on, making it easier to identify where a documented source is hosted.
Manage object followers
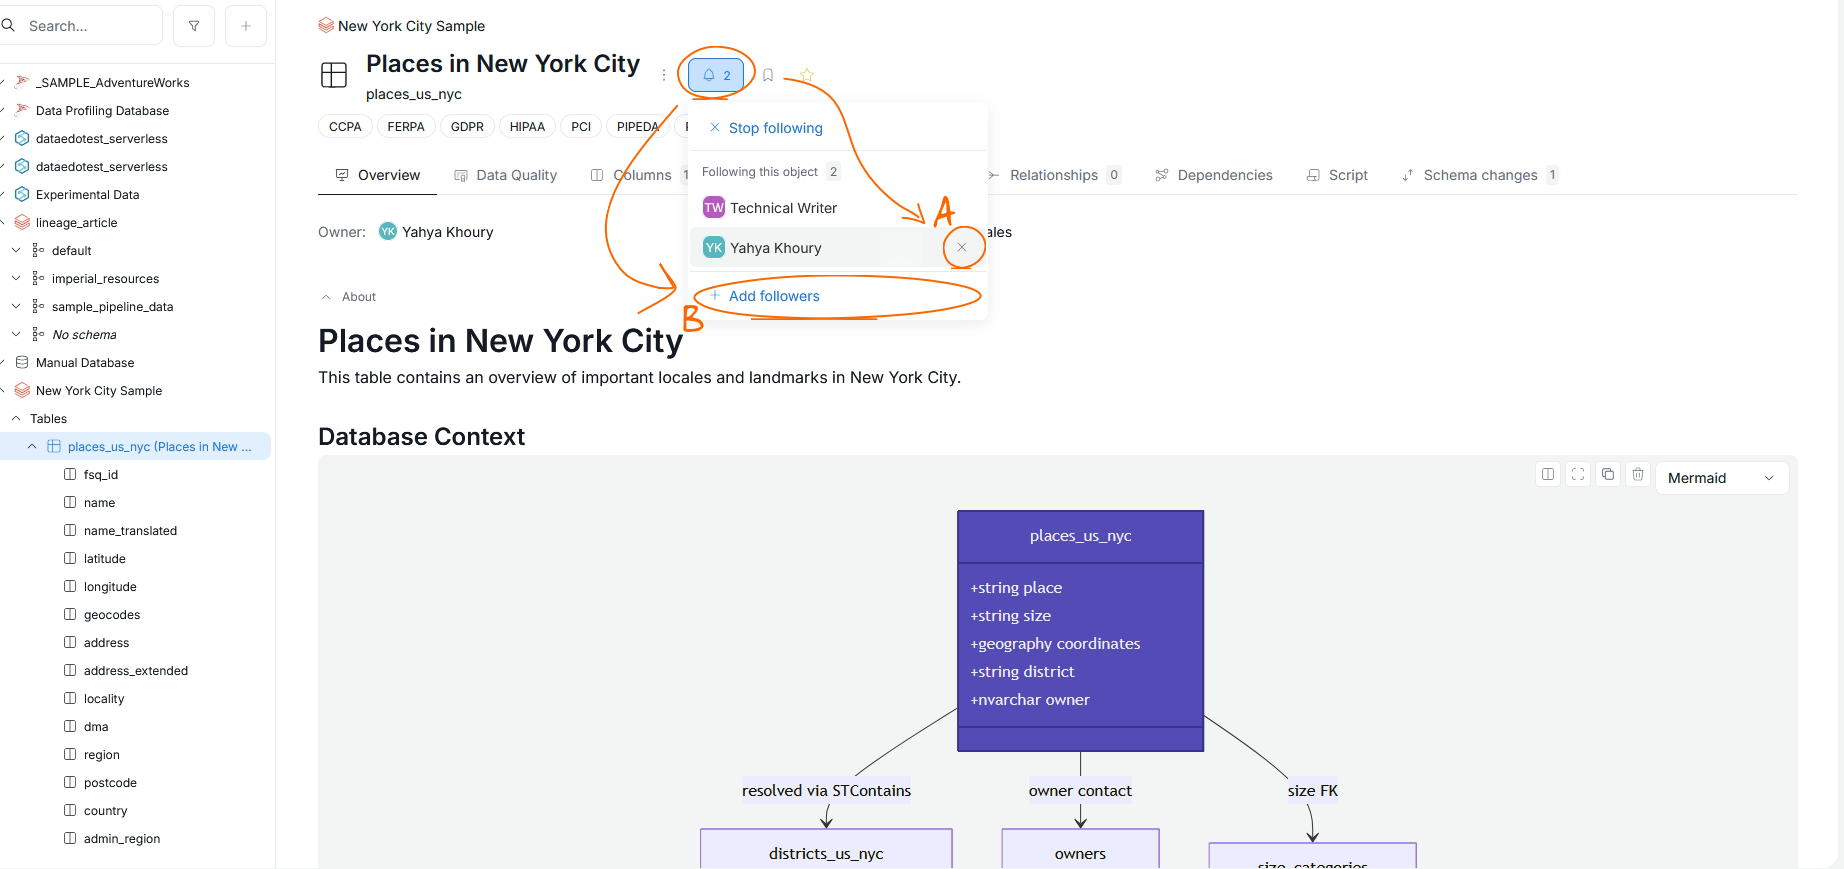
Users with Editor permissions can now manage followers of an object. When you press the Following bell, you will see a list of users who subscribe to the asset. You can add new ones [B] or remove existing ones [A].
Follow Data Quality Rule Instances
You can now follow individual Data Quality Rule Instances to get notified about their results, using the bell icon on the instance's details page. Following a database, table, or column also follows the Rule Instances assigned to it.
Followed objects panel
Followed Rule Instances now also appear in the Followed objects panel, alongside their table, column, and rule name, and can be unfollowed from there.
New Steward Hub section: Deleted objects
The Deleted objects section lets you manage, in bulk, objects that have been deleted in your original data source but still exist in Dataedo. You can remove them from your repository, or ignore them — ignored objects stay in Dataedo, and will not be flagged during the next metadata re-imports. This option is useful if you want to keep some documentation for archival purposes. Learn more here.
Extended Support for Metadata Sync
Starting from version 26.3 onwards, you can enable metadata sync for Metadata imported through the Azure SQL connector.
New Lineage for Qlik Sense SaaS
In this version, we replaced our previous heuristic approach to lineage building for metadata imported from Qlik SaaS, with an approach that utilizes Qlik's native Cloud Lineage Graphs API.