Browse data quality results
Tracking and understanding data quality results is key to maintaining reliable and accurate data. The portal provides multiple views for accessing these insights, helping you monitor rule performance, identify issues, and gain actionable insights to improve your data.
Data Quality Score and Ratio
The results of Data Quality checks are reported by Dataedo using two main aggregate metrics. Those are:
Data Quality score — represents the average success rates across all of your Rule Instances
Data Quality ratio — represents the ratio of individual success instances to the total number of Rule Instances.
To help you understand them better, let us work with an example: suppose you have a table, with five columns. You assign an individual Rule instance to each of those five columns, so you have five rule instances in total. Each of these rule instances has a threshold set — a Data Quality check is considered a success if at least 80% of that column's cells match the Data Quality rule. The results are as follows:
- Column one - OK80% correct cells
- Column two - OK100% correct cells
- Column three - Fail70% correct cells
- Column four - OK100% correct cells
- Column five - Fail0% correct cells
With this configuration, the Data Quality Score would be 70% as this is the average number of correct cells in each Data Quality Rule instance of this table. The Data Quality Ratio would be 60% instead — because three out of the five Rule Instances returned a success.
Data objects view
- Column view
- Table view
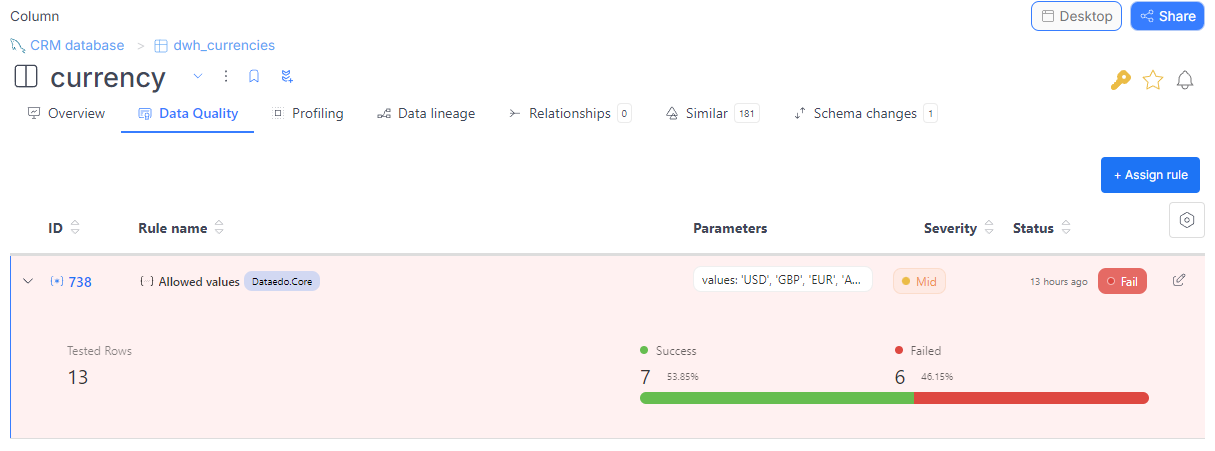
You can see a data quality score and ratio widgets displayed on the column's overview for every column with assigned data quality rule instances. This score represents the average percentage of all rule instances applied to the column, giving you a quick snapshot of its health.

In the Data Quality tab, you can dive deeper, viewing a list of applied rule instances with crucial details such as:
- Rule name:
Valid JSONDataedo.Utils
- Parameters:
value=[creation_date] - Severity: CriticalHighMidLow
- Status of the latest run: OKFailError
- Timestamp of rule execution

When expanded, each row displays the number of tested rows, any filters that have been applied, the count and percentage of passed and failed rows, and an instance description.
You can see a combined data quality score and ratio widgets at the table level on the overview page.

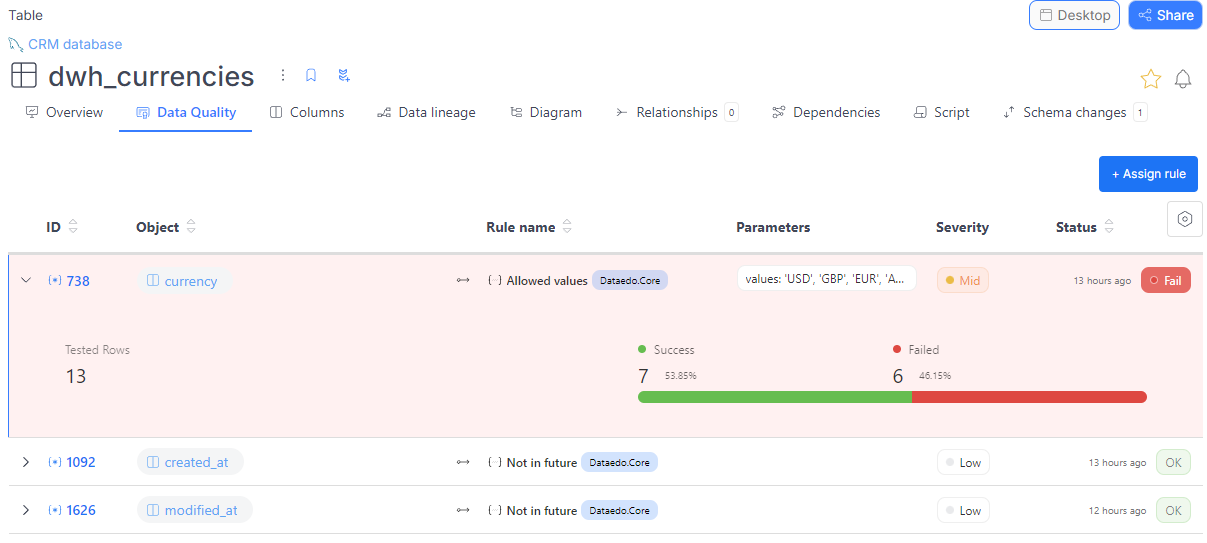
The Data Quality tab works for tables similarly to columns. It provides a detailed list of all applied rule instances and their attributes, such as:
- Rule name:
Valid JSONDataedo.Utils
- Parameters:
value=[creation_date] - Severity: HighMidLow
- Status of the latest run: OKFailError
- Timestamp of rule execution
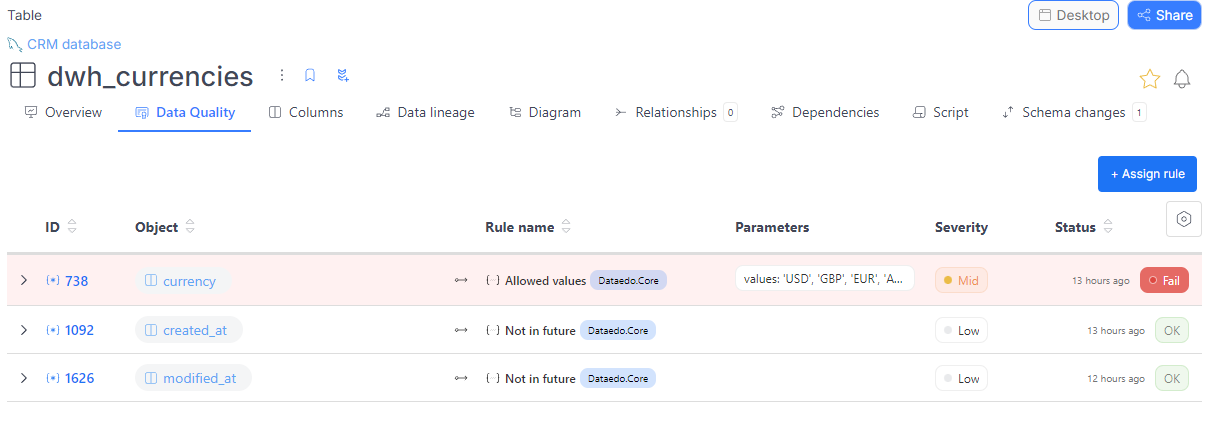
When expanded, each row displays the number of tested rows, any filters that have been applied, the count and percentage of passed and failed rows, and an instance description.
Rule instances list
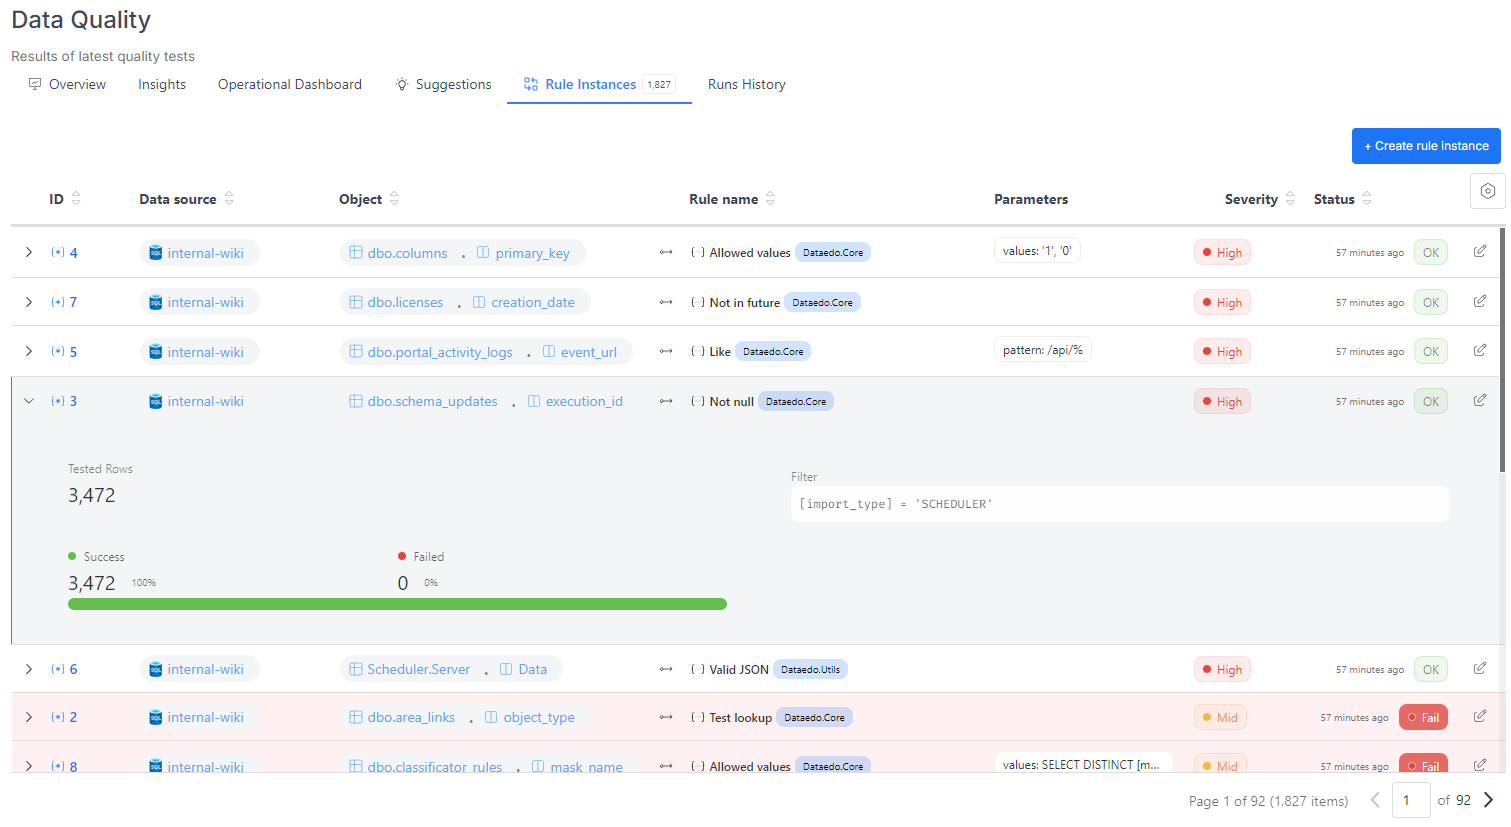
The Data Quality tab in the main menu offers a repository-wide view of all rule instances. This list allows you to track instances across columns and tables with details like:
- Rule name:
Valid JSONDataedo.Utils
- Parameters:
value=[creation_date] - Severity: HighMidLow
- Status of the latest run: OKFailError
- Execution timestamp
By default, instances are sorted by the most recent timestamp, severity, and status to prioritize critical issues.
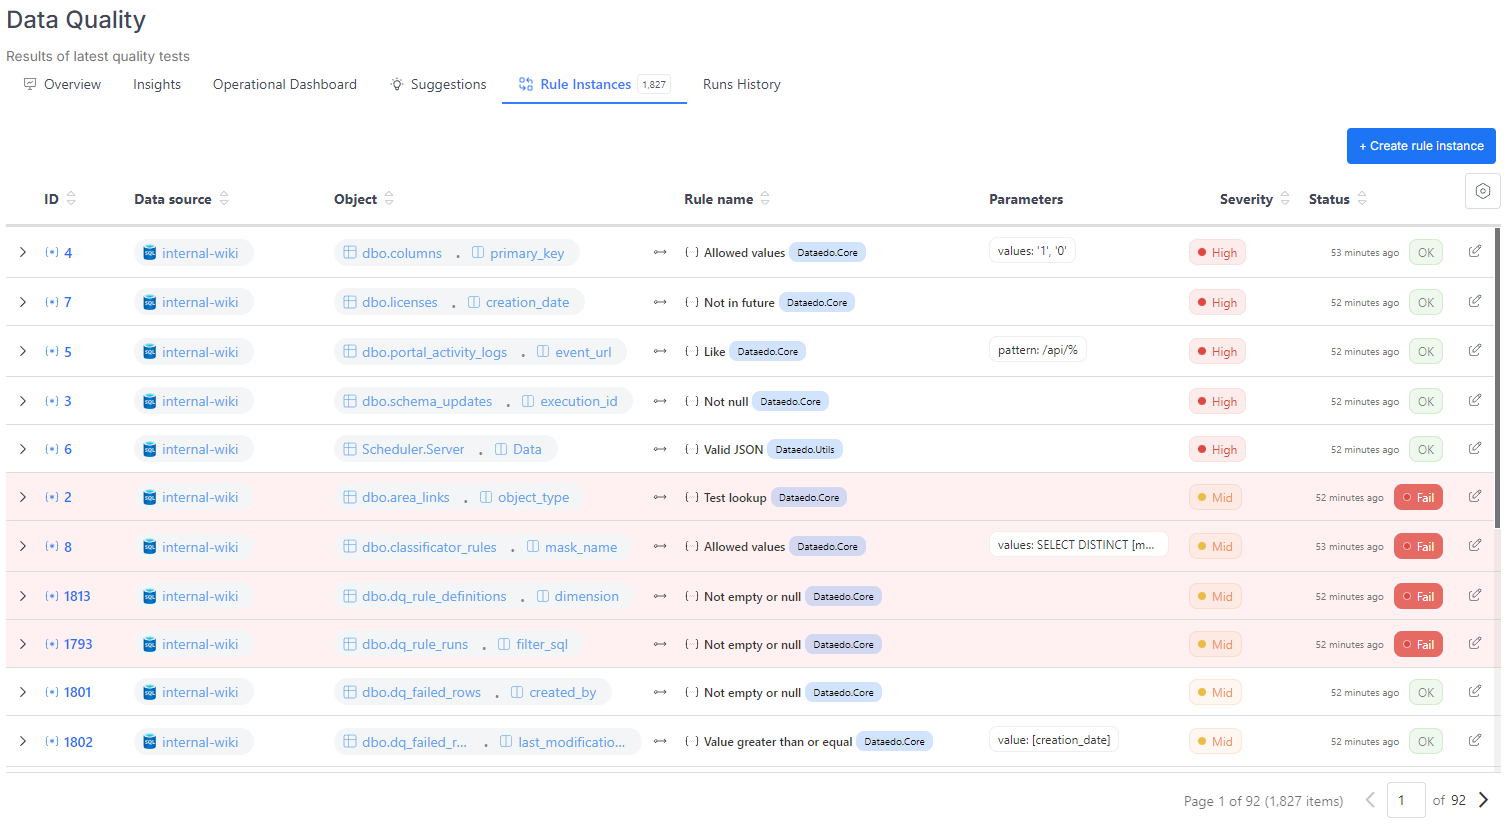
When expanded, each row displays the number of tested rows, any filters that have been applied, the count and percentage of passed and failed rows, and an instance description.
Rule instance details
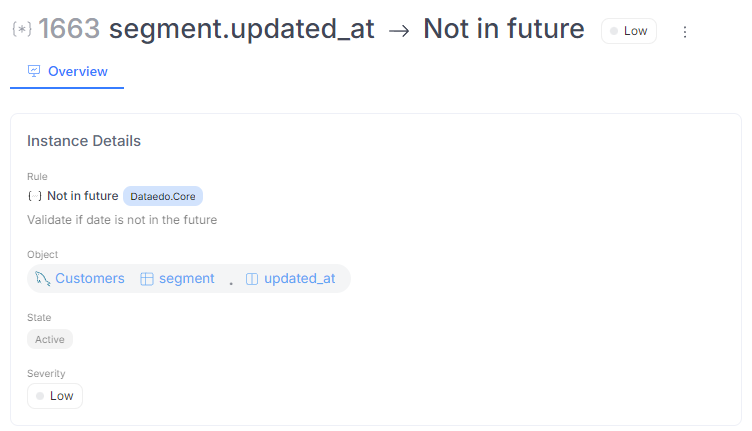
For deeper insights into any rule instance, click its ID in any list to navigate to its details page.
If the instance hasn’t been run yet, the page displays basic information such as:
- The rule to be checked
- The column selected for the check
- Instance state (active or draft)
- Severity
- Applied filters (if any)
- Instance description (if provided)
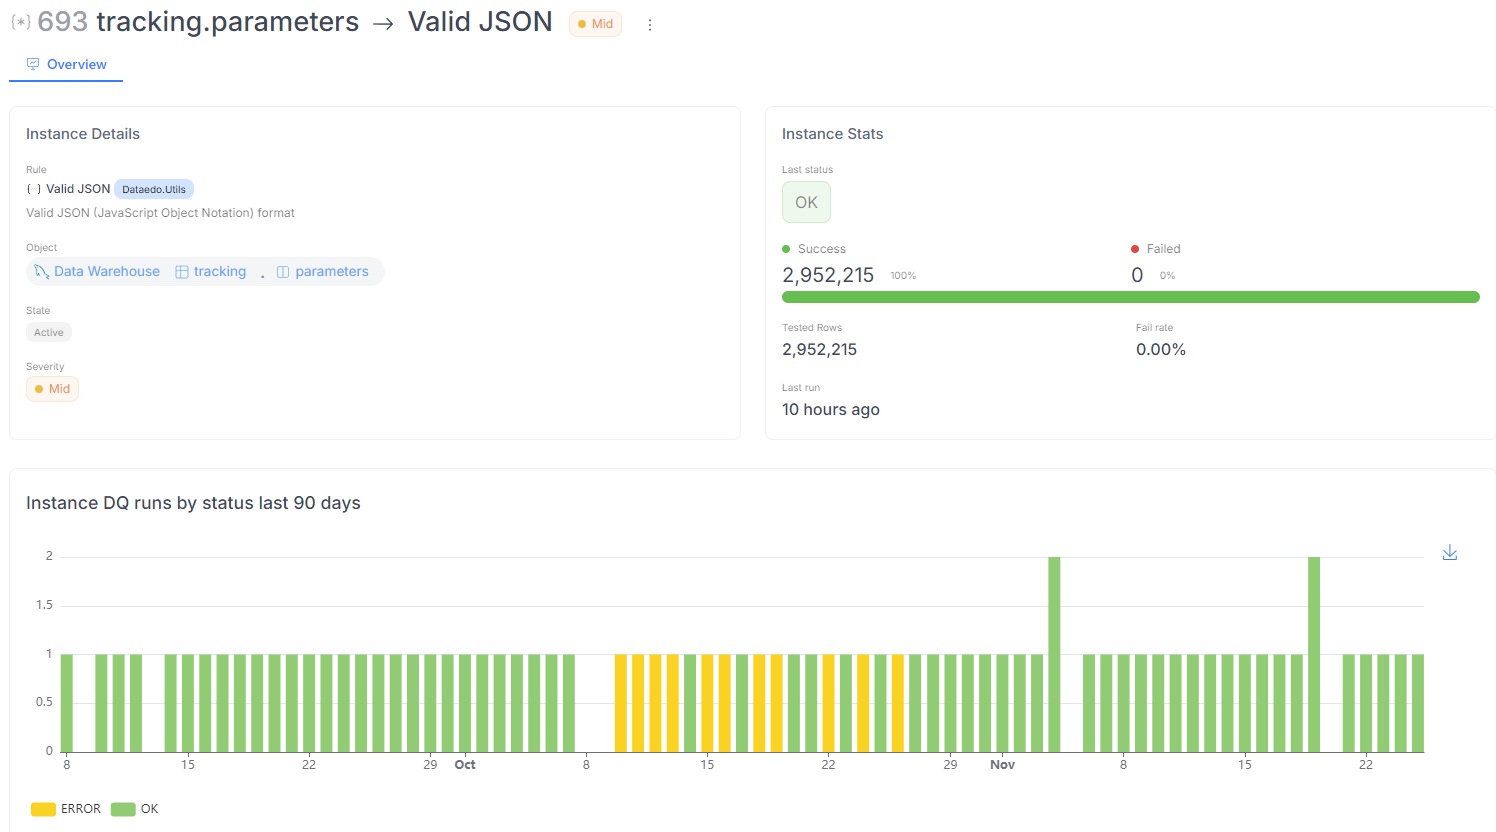
If the instance has been run, you'll see additional details:
- Status of the last run (OKFailError)
- Progress bar with the count and percentage of successful and failed rows
- Total tested rows and fail rate
- Timestamp of the last run

A button provides access to raw error details for troubleshooting in instances with errors. If you encounter issues, you can contact our support team for assistance.

At the bottom of the page, widgets visualize historical trends, including status history and the number of failed rows over time:
Downloading failed rows
The View Quality and Profiling Data permission is necessary for this action. This means that Viewers can't download failed rows.
If the Save Failed Rows feature was enabled when creating a Rule Instance whose details you are viewing, you can download all rows that failed the check in your repository. If any failed rows are recorded, you will see a counter next to the Failed Rows tab. In that tab, you can click on the menu icon and choose to download the rows as either a CSV or an XLSX file. If you need, you can perform additional filtering in the top part of the page.

The extracted file will contain failed rows from all pages in your repository.
Dashboards
Dataedo dashboards provide a comprehensive understanding of your data quality:
- The Overview Dashboard offers critical statistics, including the overall data quality score, the number of defined rule instances, and a breakdown of data quality runs by status. These metrics provide a quick snapshot of your system's health.
- The Insights Dashboard highlights actionable data, such as identifying empty columns and tables, missing data in unique columns, and columns with significant row count changes (increases or decreases). These insights help you detect issues early and prioritize fixes efficiently.
Instance status
Each rule instance has one of the following statuses:
- OK: All rows passed the assigned rule, confirming the data meets expectations.
- Fail: Some rows did not meet the rule criteria and require attention.
- Error: An issue occurred during the data quality check, which could result from:
- A timeout
- Incorrect parameters
- A filter problem
- An issue with the failed rows definition
You can view detailed information on the instance details page to investigate errors. Navigate to the instances list for a column, table, or the Data Quality section in the main menu. Click the instance ID to be redirected to its details page, where the error information and status are displayed. This process allows you to diagnose and resolve issues effectively.

Data Lineage Diagrams
Results of Data Quality can also be seen when inspecting object's Data Lineage. An indicator will show next to an object with defined Rule Instances. A green indicator signifies that Data Quality checks have been passed successfully, while a red one means that at least one check failed. When you hover over an indicator, you will have the option to navigate to full Data Quality breakdown using the Analyze Data Quality results button.
Data Quality indicators
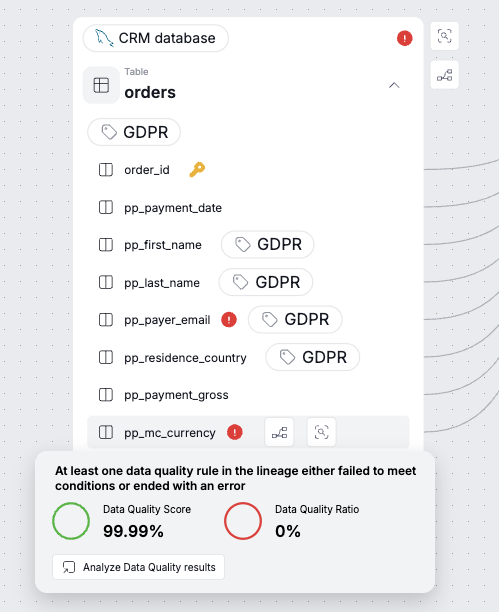
You can find a more nuanced explanation of Data Quality indicators in the dedicated article.
Data Quality in Domains
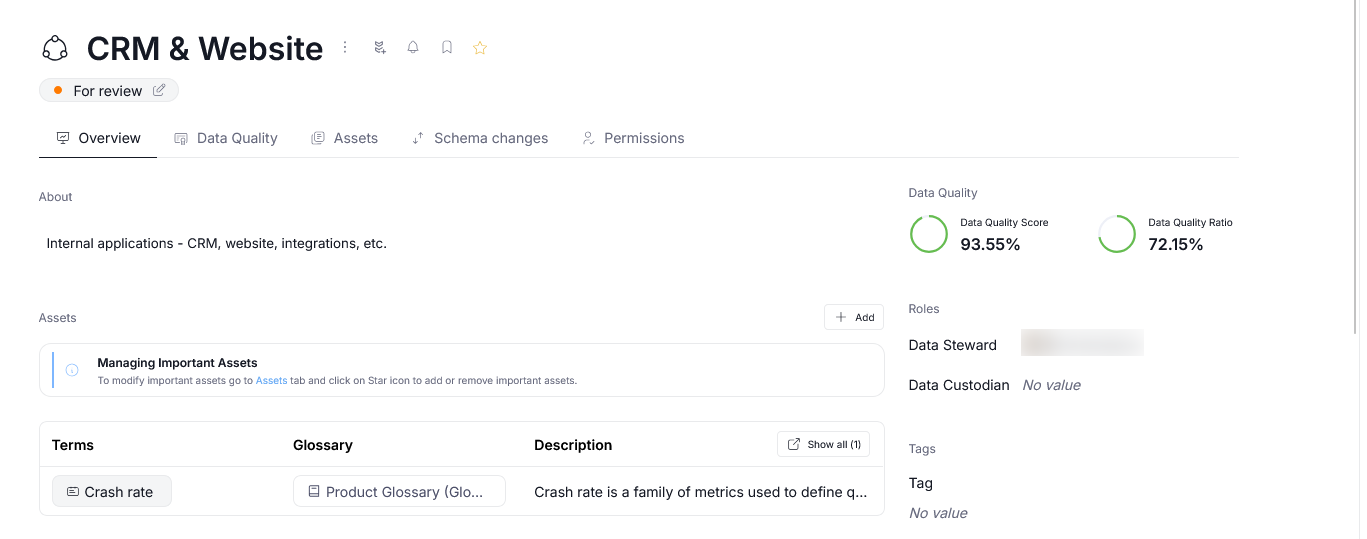
Domains and Data Products display Data Quality widgets, using data aggregated from all Rule Instances applied to their assets. However, only assets linked to Areas/Data Products that are in a Workflow status which is visible to non-editors (published if using Dataedo's custom configuration) will be taken into account. This is done to ensure, that Data Quality information is derived based on assets accessible to all users. Learn more here.

