Data Lineage in Dataedo Portal
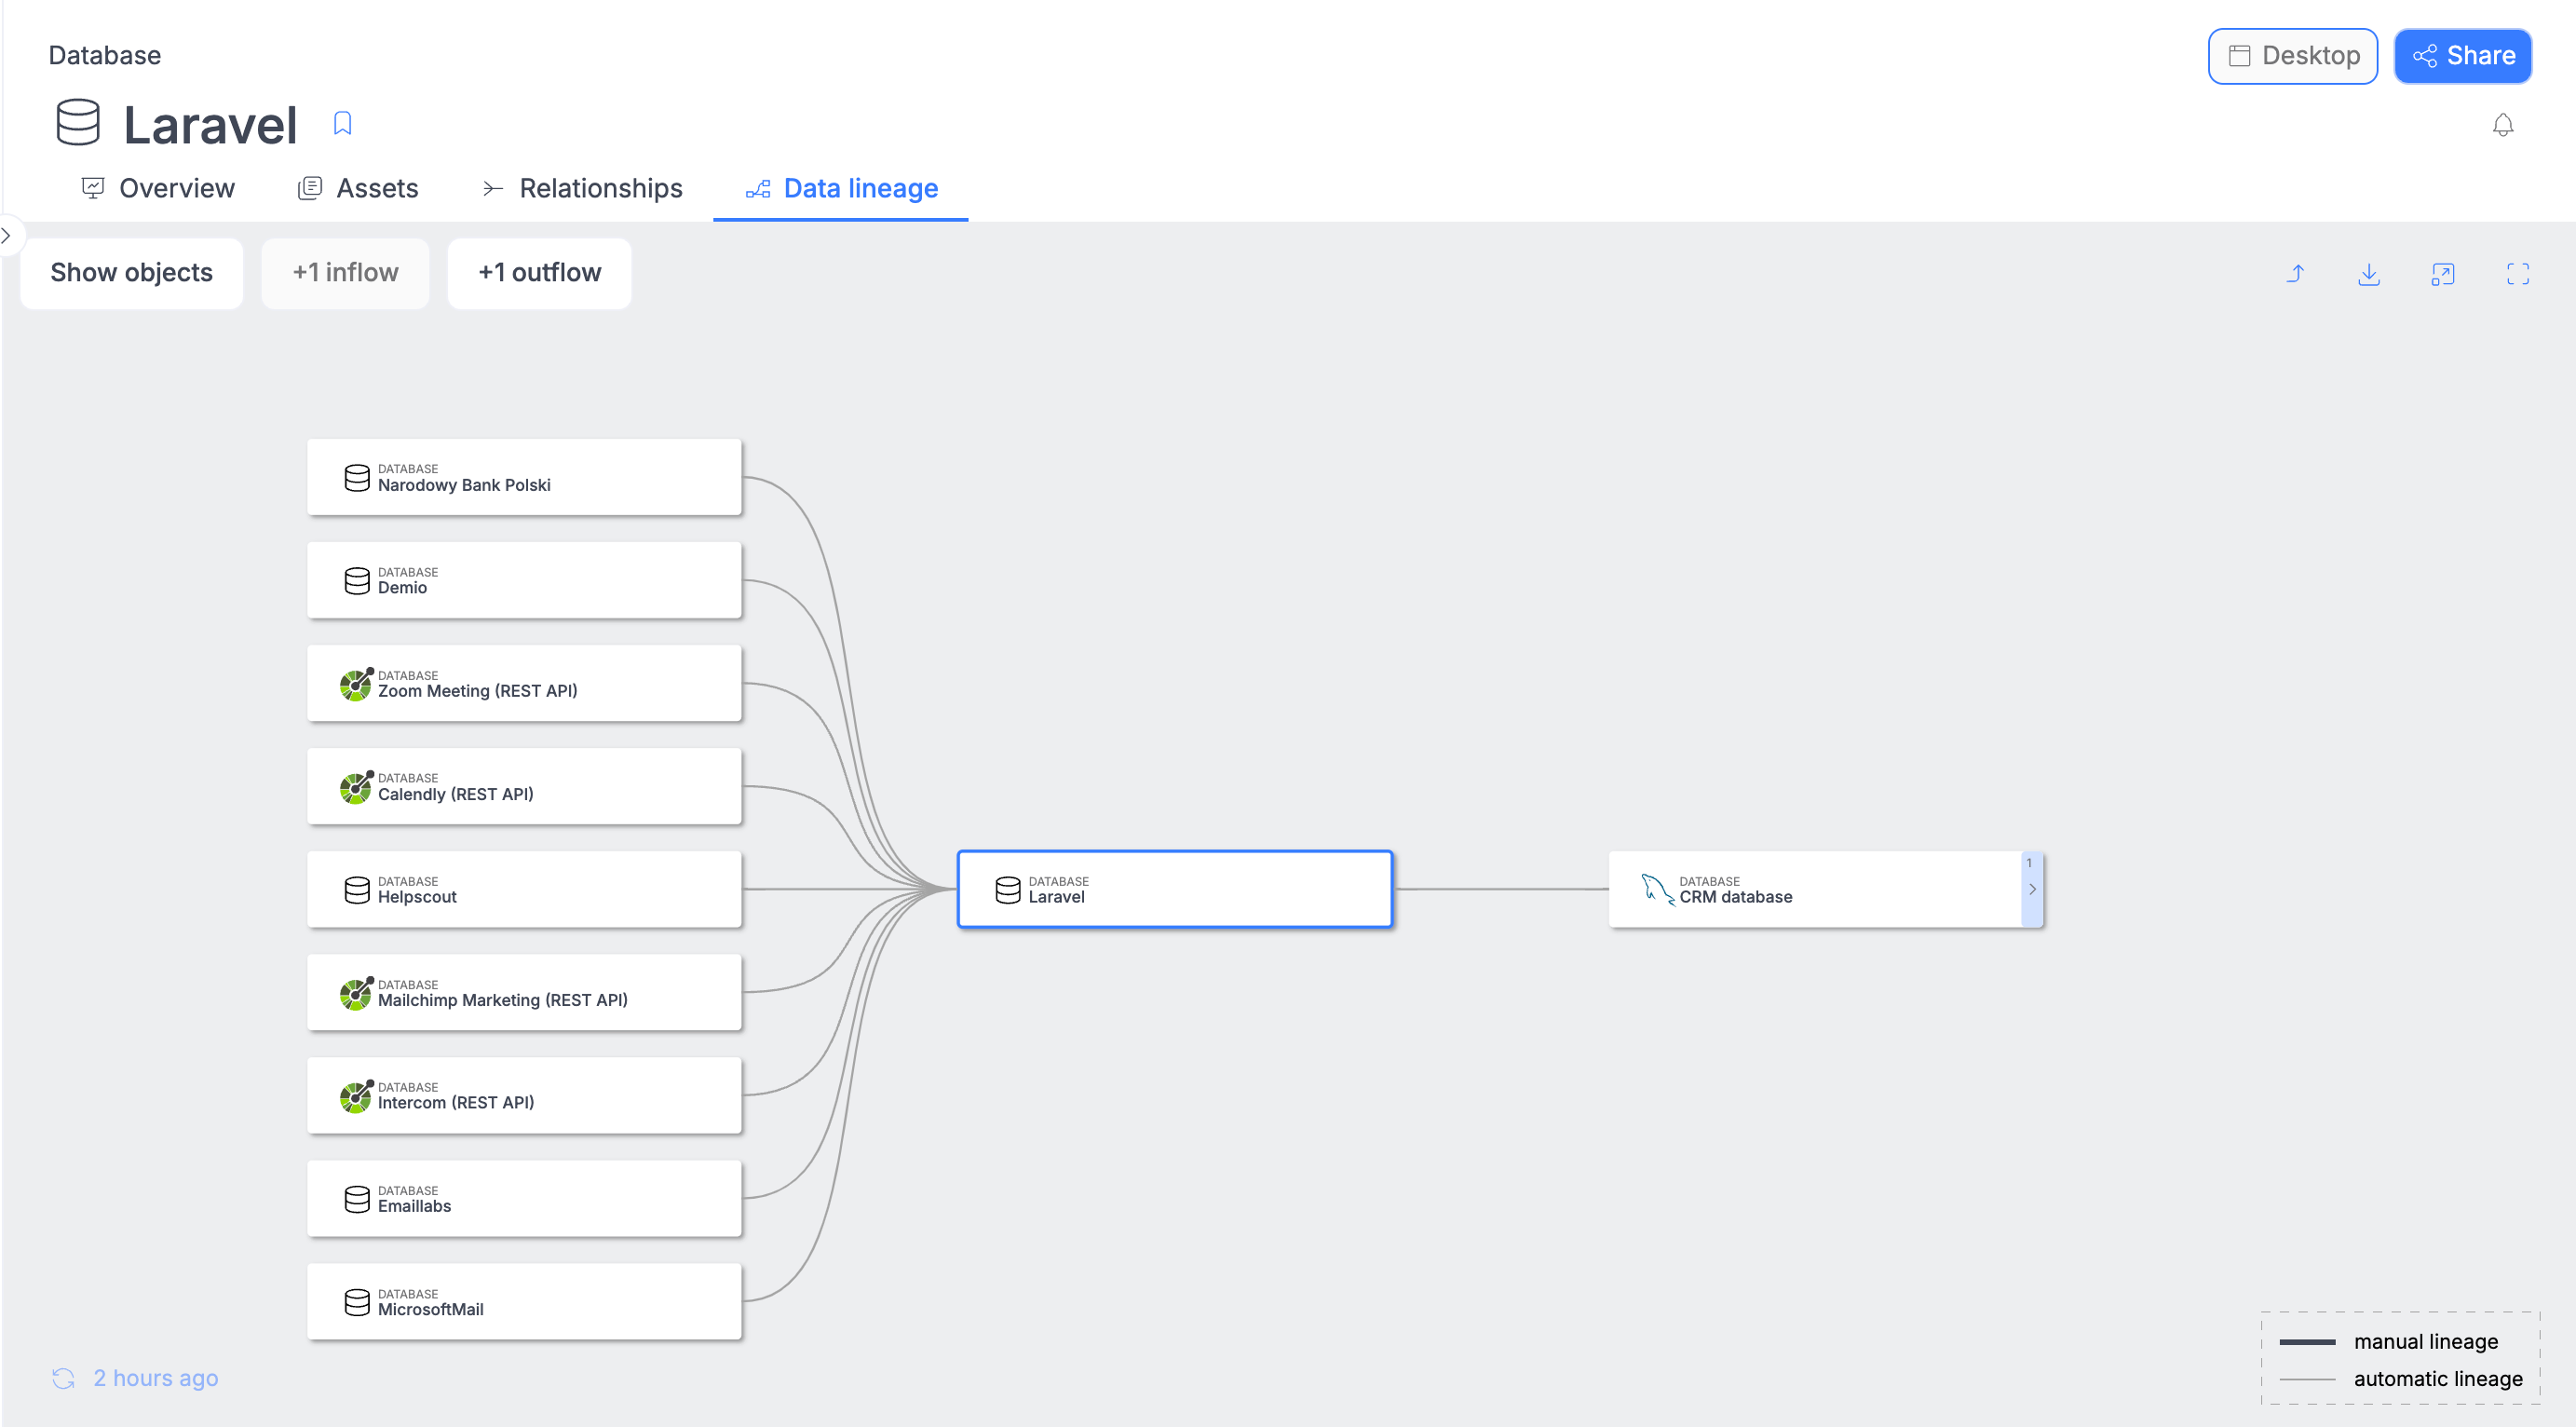
After you configure Data Lineage in Dataedo Desktop, you will be able to browse the interactive diagrams in the Portal.
Viewing diagrams
Data Lineage diagrams are available for tables, views, structures, procedures, and functions. Moreover, aggregated diagrams are also available in the database or module context.

Navigating through diagrams
Different object types are marked with different icons on diagrams ( , , , , , ). Additionally, we have a few tips that can help you use Data Lineage effectively:
- Click on an object to track its flows.
- Double-click on an object to view the diagram in its context.
- Use your mouse to zoom in and out.
- Drag the graph to focus on the most interesting area.
Which flows are on diagrams?
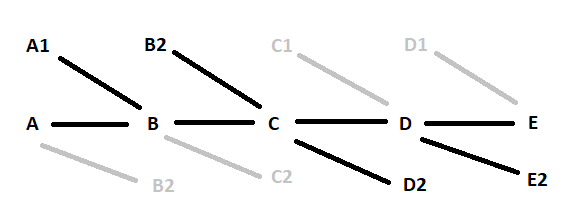
Depending on what subpage you are on, the diagram will contain different objects. By "Lineage for a given object," we understand a recursive summary of all inflows and a recursive summary of all outflows.

So in the above example, data flows from left to right. "Lineage for C" contains all flows marked with black and does not contain flows marked with grey.
Context and details
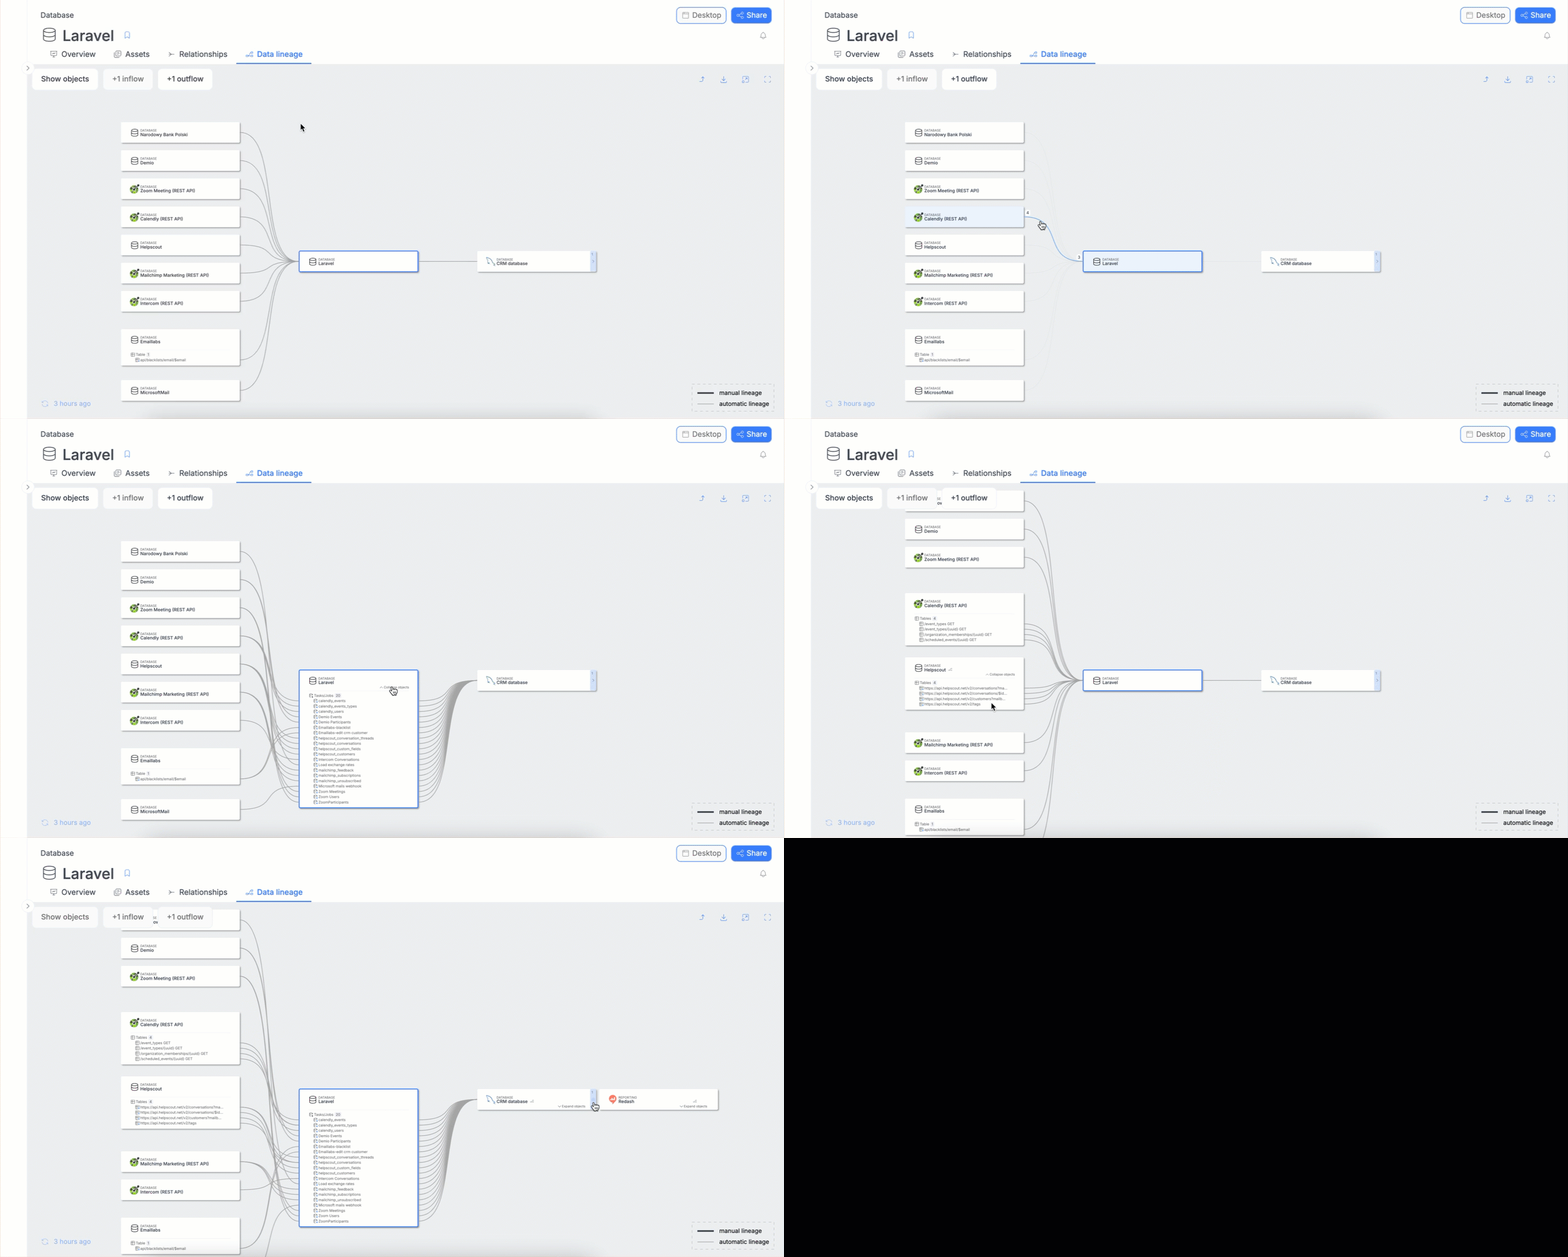
You can tell that you are in the context of an object as it'll be highlighted once you click it. You can expand objects to see detailed lineage view, or click the lineage line to highlight connected objects:

- In the case of a module, all objects from a module are marked green.
- If none of the objects are green, then you are browsing in the database context.
| Context | What is visible? |
|---|---|
| Table, View, Procedure, Function, Structure | Lineage for the selected object. |
| Database | Lineage for all objects in the selected Database. |
| Module | Lineage for all objects added to a Module. |

