Indicators on lineage
Lineage's role in helping you trust and quickly analyze your data is further amplified by the introduction of indicators in Data lineage diagrams. Data Quality indicators, Badges, and Classification tags are displayed on objects, making it easier to notice potential issues regarding data outflows or downstream artifact creation, as well as quickly ascertain the reliability and importance of data participating in the dataflow.
Data Quality indicators
Currently, Data Quality indicators are displayed only on objects where Data Quality can be defined (Tables and Views). Other objects, like Reports won't display the indicators, even if they were created using objects with defined Data Quality.
The appearance of the indicator depends on results of Rule Instance checks applied to the object. A green indicator means that all Rule checks passed, and a red one signifies a failure of one or more of the checks.
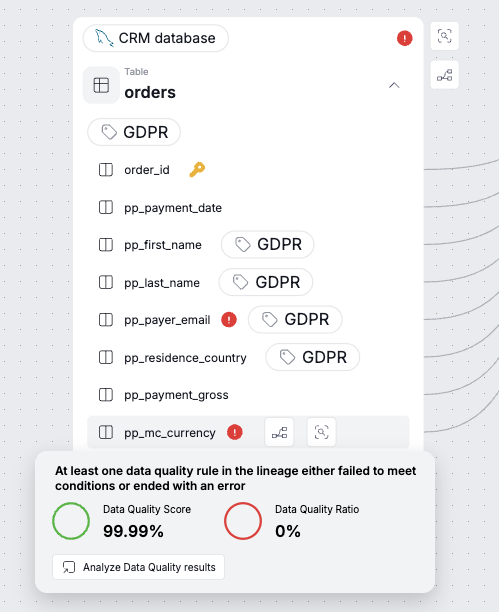
When you expand the Table object node with a red indicator, you will see a list of columns. A red indicator will be shown next to every column that fails its Data Quality checks.
When you hover over an indicator you will see an overview of Data Quality. You can also navigate to a full Data Quality breakdown by clicking the Analyze Data Quality Results button.
Data Quality indicators
Remember that the set-up of your Rule Instance determines how the indicator functions. Factors like modified thresholds or rule-definition errors will impact its behavior.
Badges
Badges serve as a visual system for highlighting important data in your organization.
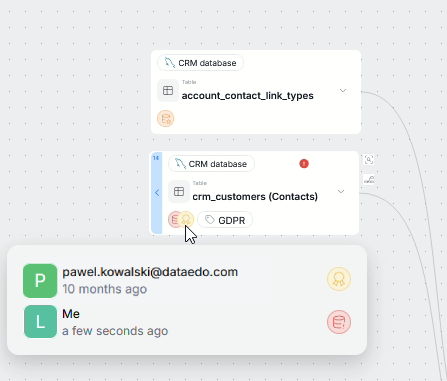
All the badges assigned to an object will also be visible on its node within the lineage. Additionally, when you hover over a badge, you will see when, and by whom it was assigned.
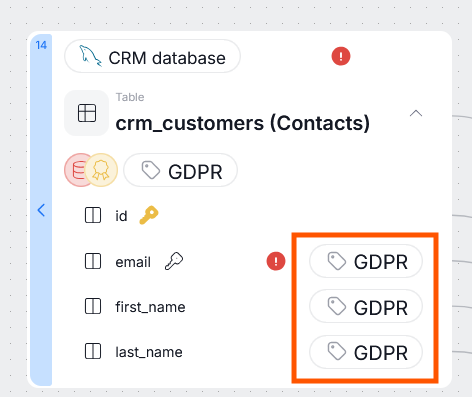
Classification tags
Classification in Dataedo helps you keep track and classify columns that hold sensitive data.
Those tags are displayed in the Lineage Diagram next to classified columns — helping you quickly understand whether you are working with restricted information.