Steward Hub — Data Profiling
Profiling results are hidden from Viewers until you publish them. This gives Data Stewards control over how much detail — especially for sensitive columns — is exposed in the catalog. The Data Profiling module lets you review Data Profiling results before they become visible to users in your repository. You can adjust them and publish them in bulk.
View
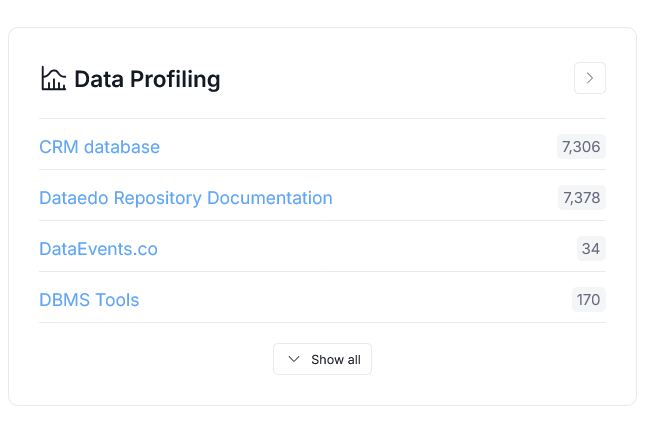
The module is organized by data source. Selecting a source opens a list of its columns together with their suggested profiling configuration.
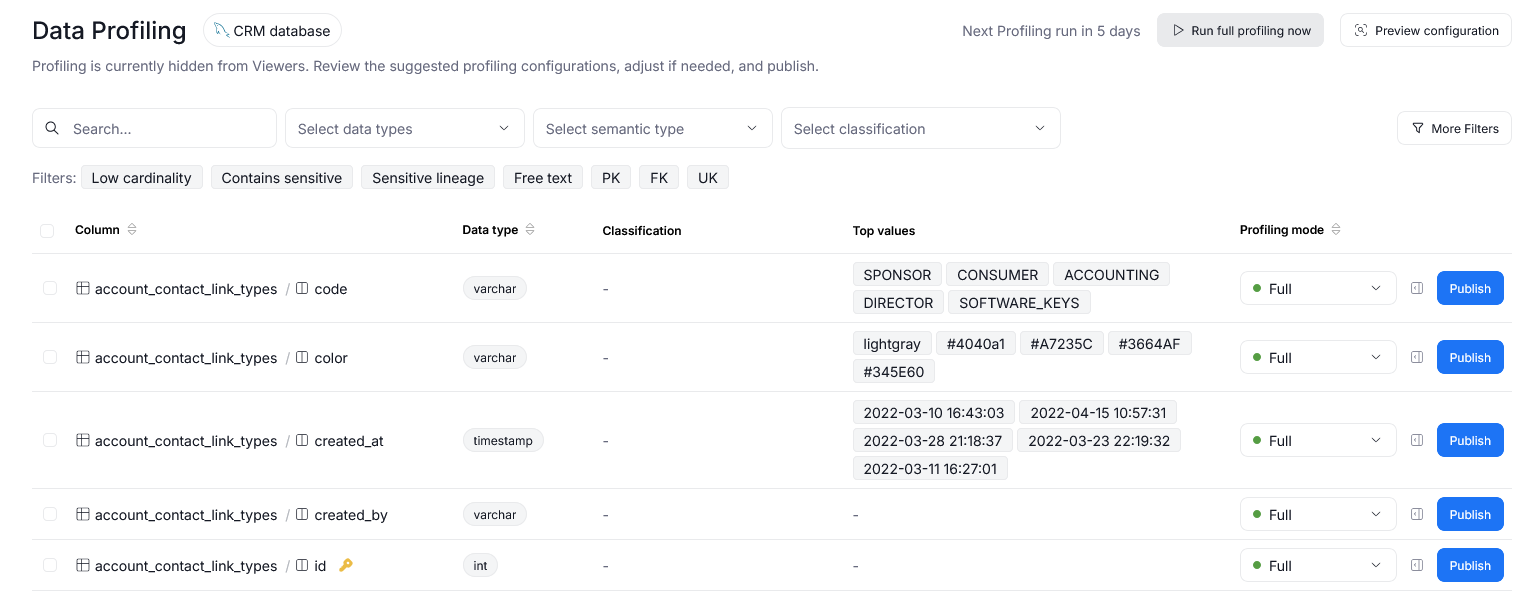
Each row shows the column and its parent object, the detected Data type, its Classification, the column's Top values (if Full profiling is enabled), and the Profiling mode suggested based on Profiling Configuration.
Profiling modes
The Profiling mode determines how much of a column's profile is published:
- Full — all profiling results, including statistics, distributions, and sample values, are shared.
- Statistical — only aggregated statistics are shared, without sample values. A good option for columns that hold sensitive data.
- None — profiling is not shared for this column, and any existing results are removed.
Running profiling
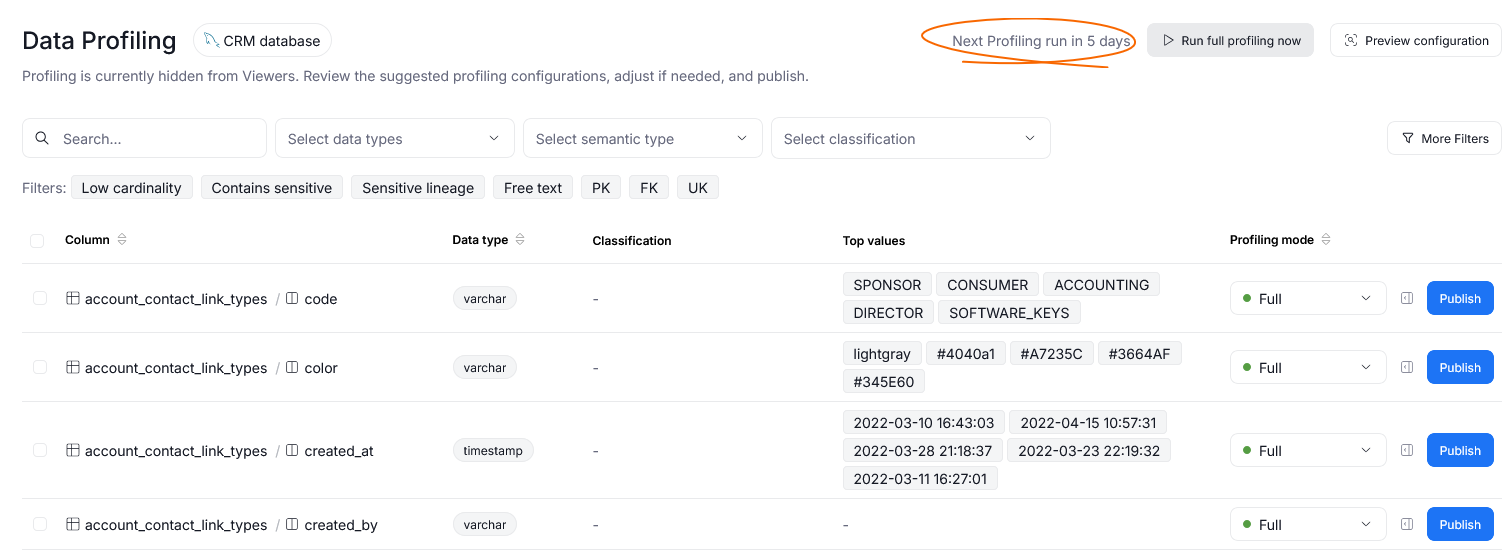
Steward Hub shows all profiling results that are not yet published. The results are always based on the last profiling run. The top-right corner shows information about the next profiling date.
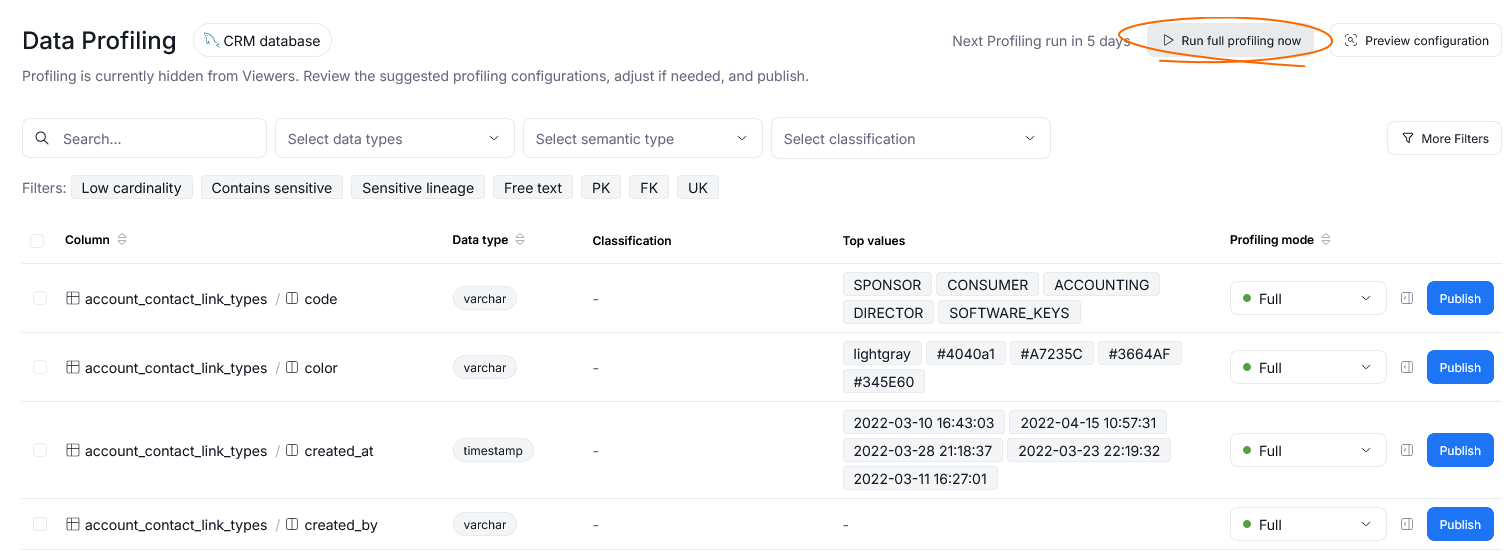
If you have the Connection Manager permissions, you can also start an unscheduled run using the Run full profiling now button. This is helpful if you want to make sure you are reviewing the most up-to-date results.
Filtering
You can narrow the list to focus on the columns you want to review. A search bar [A] filters columns by name; you can also filter by Data Type, Semantic Type, and Classification [B]. Additionally, a dynamic set of quick filters [C] based on common profiling badges lets you limit the list to columns with specific data characteristics. Additional filters — for a full list of badges or for filtering by Owner — are available after clicking More filters [D].

Previewing a configuration
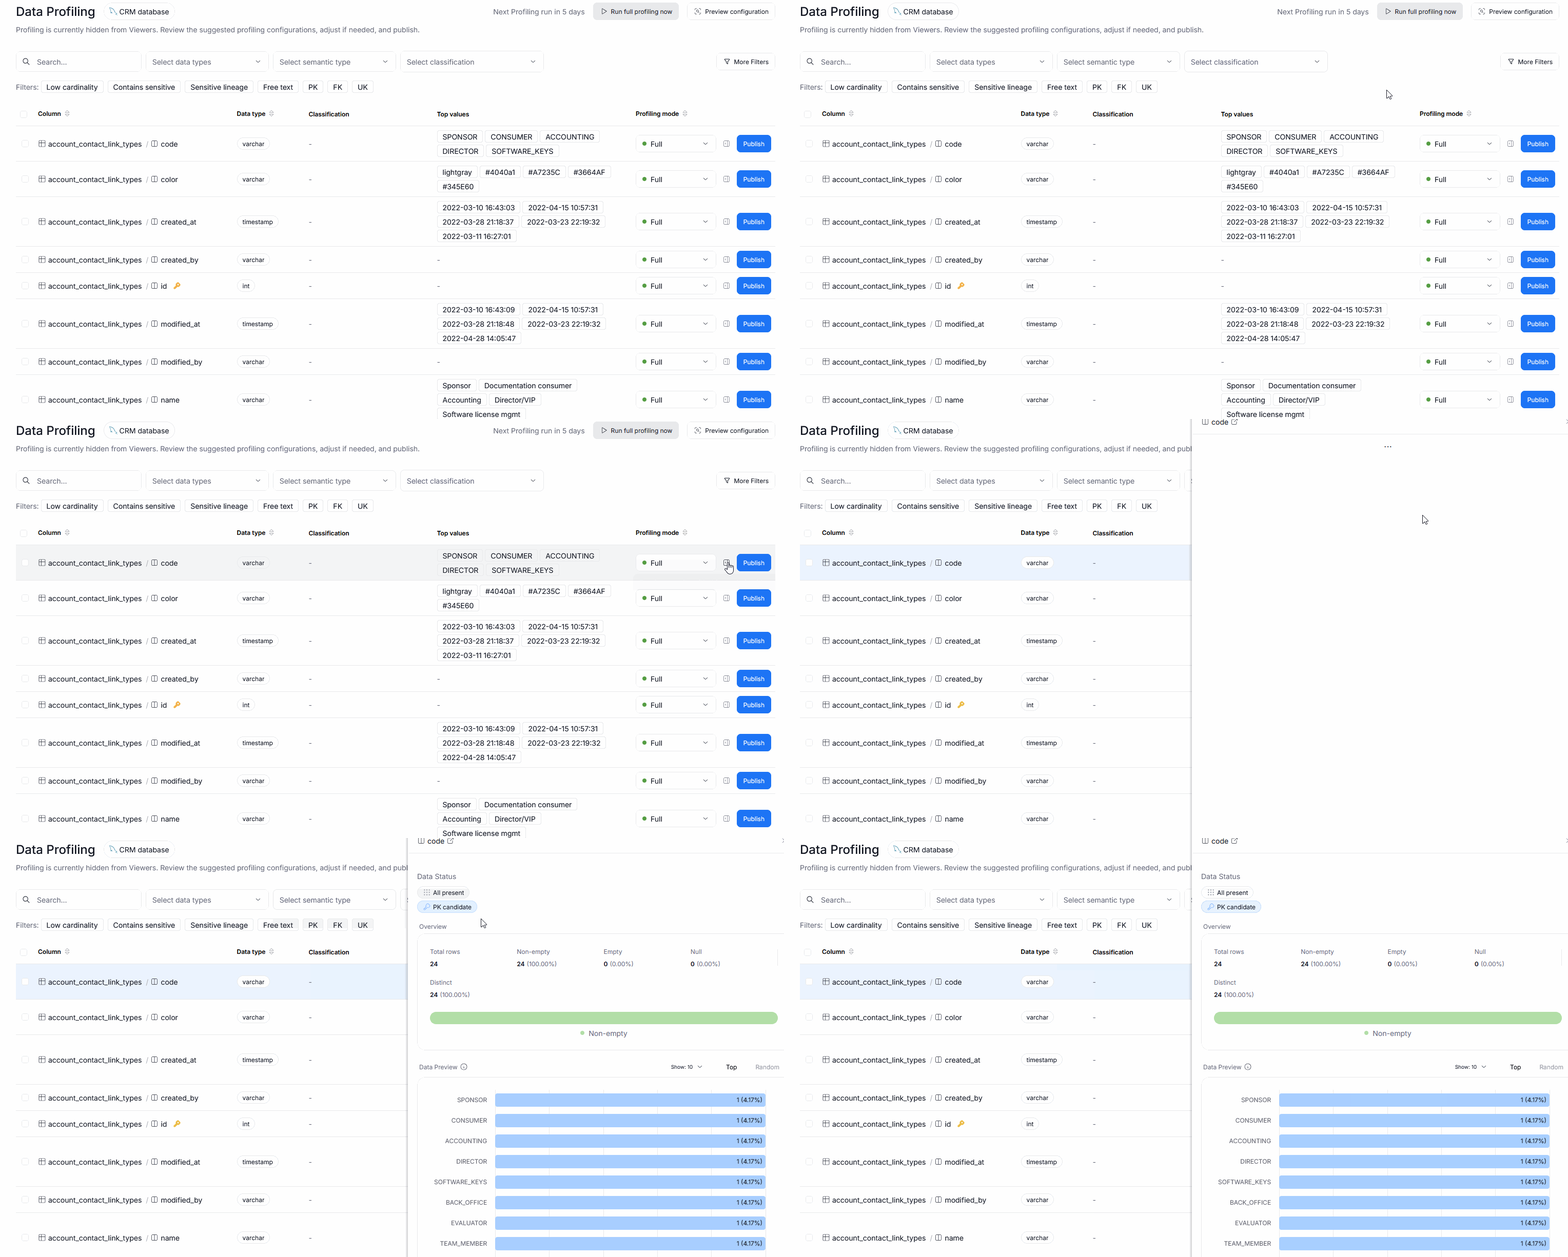
Before publishing, you can click the row, or use the preview button to open a column's results in a side panel to see exactly what will be shared with your users, given the selected mode. The preview includes the column's statistics, sample data, distribution, and profiling badges.
Publishing
To publish a single result, make sure to adjust its profiling mode if needed [A] and then click publish [B]. This will make this column's profiling visible to all users.

Bulk Actions
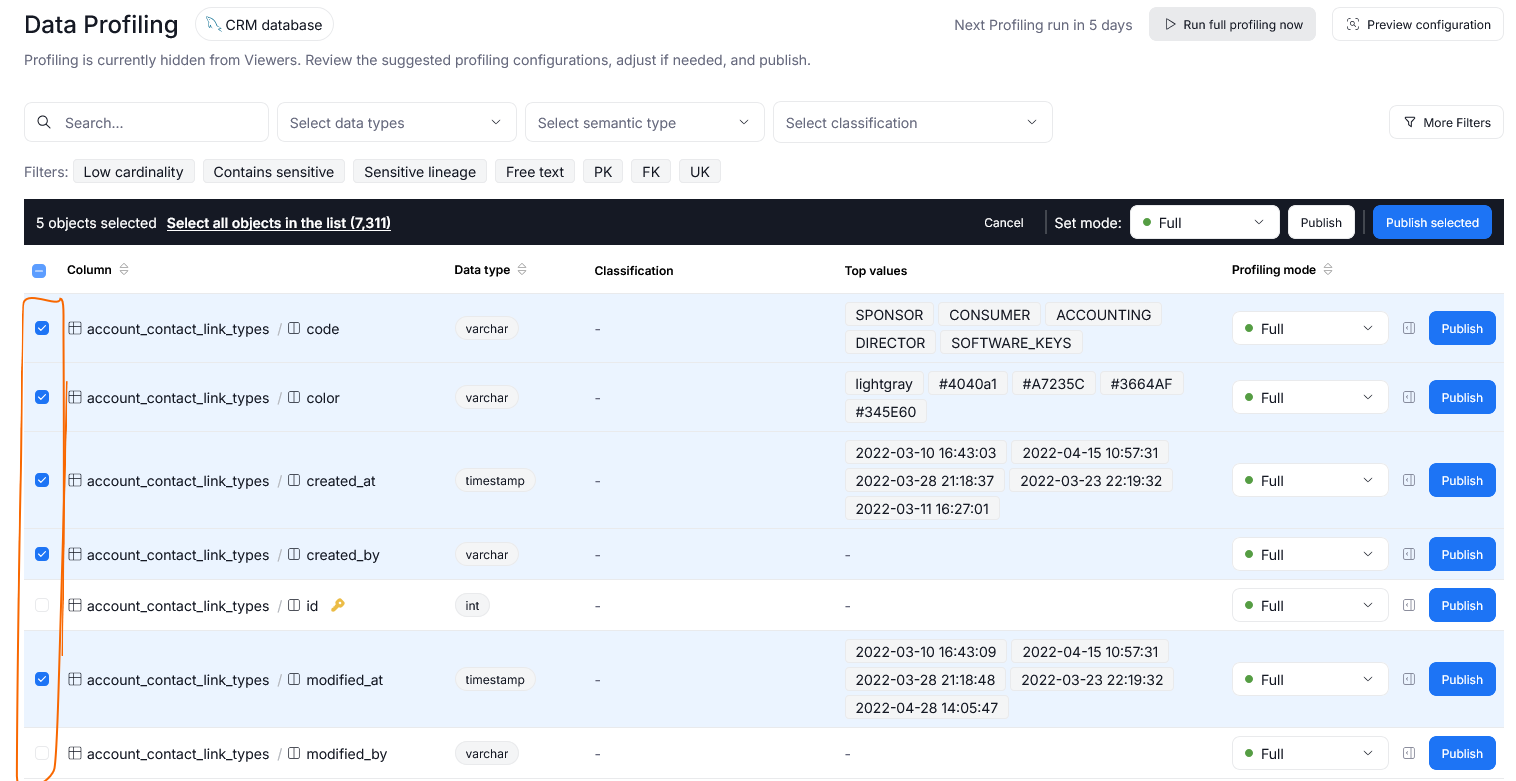
You can also adjust and publish columns in bulk. To do that, first select all profiling results you want to modify using the checkboxes next to their names.
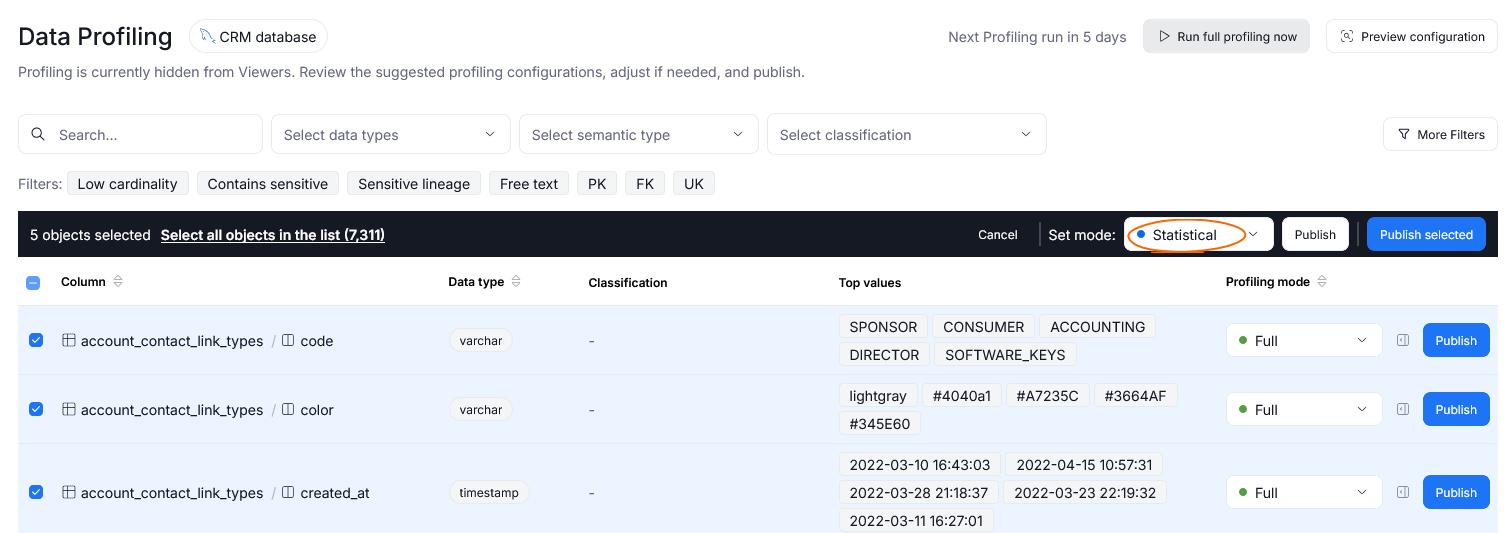
Once this is done, you can change the profiling mode for all selected columns using the set mode section.
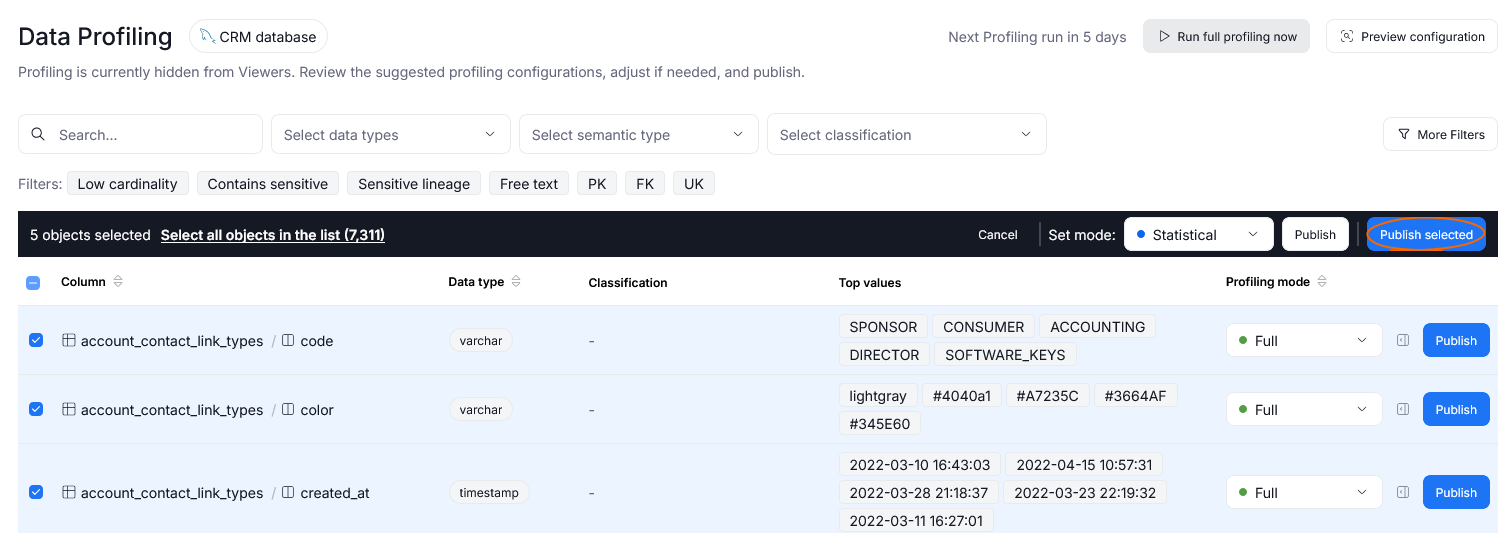
You can also publish all selected profiling results using the publish selected button.
Blocked profiling
Data Profiling can be blocked if your column has too many rows, or its cumulated data is greater than a certain threshold (5 GB by default).
Those columns can still be profiled and published using Steward Hub. To view columns whose profiling was blocked, use the Row limit exceeded or Data size limit exceeded filters.
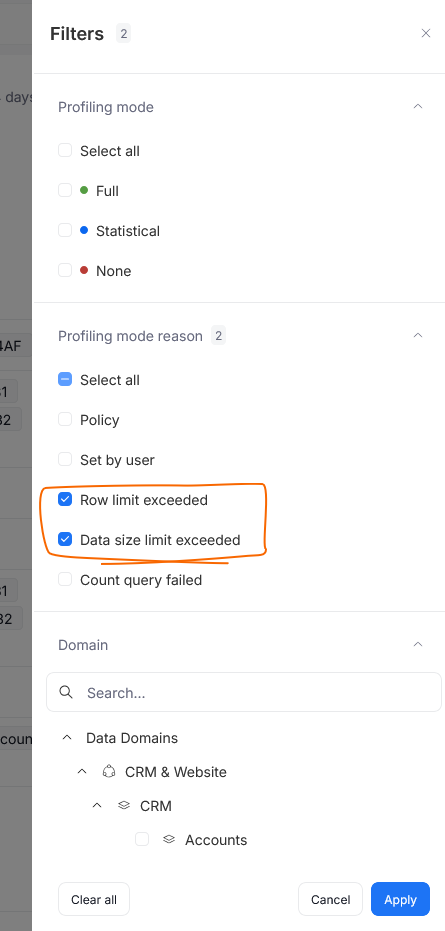
When you change a column's Profiling Mode that way, and publish it it will be profiled despite crossing the thresholds.
Alternatively, if you want to permanently raise/remove the thresholds, you can do so in the repository. Simply modify the DATA_PROFILING_TABLE_ROW_COUNT_LIMIT and DATA_PROFILING_TABLE_DATA_SIZE_LIMIT_GB parameters in dbo.configuration table.

