Domains
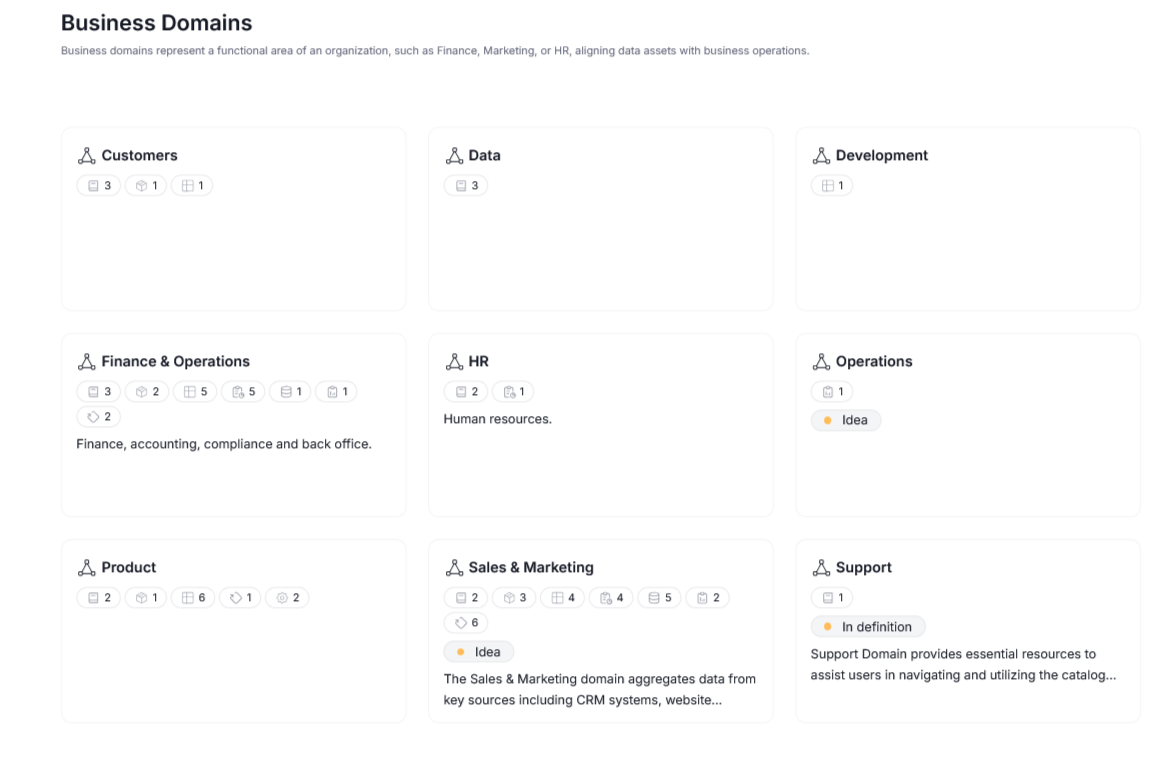
Domains in Dataedo are logical, user-defined collections of assets in your repository. Domains take inspiration from the data mesh approach, helping you organize your data assets according to their purpose and ownership. The two domain types — business and data — correspond to two major ways in which the divide can be conceptualized. Data Domains are concerned with the perspective of Data and IT teams, highlighting asset structure and management. Business Domains on the other hand, correspond to asset distribution across different departments and business areas; think HR, Finance or Customers.
Structure
Domains are modular. Top-level domains can have sub-domains nested within it. Those sub-domains are called Areas. You can also nest additional Areas within Areas, resulting in potentially complex multi-level structures reflecting real-world division of your data assets. Those relationships are hierarchical. The Domain serves as a parent to all Areas nested within it. If an Area has other Areas nested within it, they also participate in parent-child relationships.
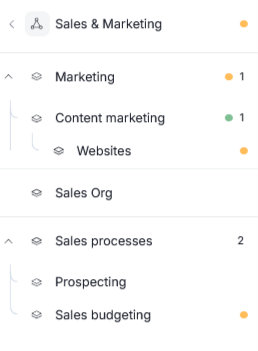
Domains with no parents are called Top level domains and are displayed on the Domain screen
While Domains and Areas can have multiple children, Domains have a maximum depth of 4. This means that a maximum structure is Domain -> Area -> Area -> Area.
Navigation
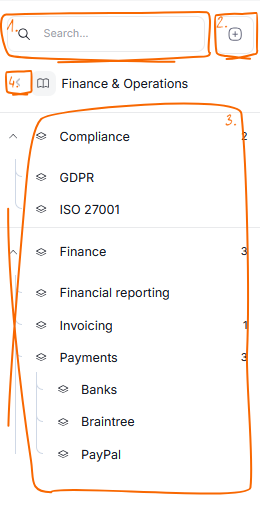
When you open a Domain or an Area, a sidebar will appear. This sidebar contains a search bar [1] and an add button [2] allowing you to create new Domains/Areas. The sidebar also shows the structure of your currently opened Domain which can be further inspected by expanding the nodes [3], and features a back arrow [4], which allows you to quickly return to a view of all Data or Business Domains in your repository (depending on what type of Domain you are currently viewing).
Assets allocation
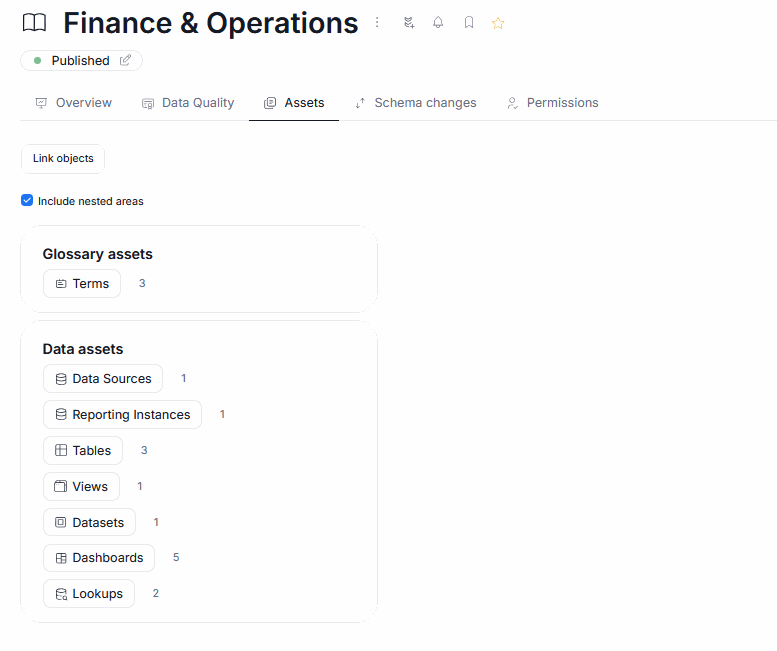
Assets can be allocated either directly to a Domain, or any of its nested Areas. Asset ownership works in a bottom-up manner — assets available in a given Domain or Area are a sum of its own assets and the assets of its children. You can view available assets using the Assets tab. By default, all available assets are displayed, you can unmark the Include nested areas checkbox to view only assets that are assigned to the particular Domain or Area you are viewing. Learn more about asset allocation here.
Data Quality
If assets for which Data Quality can be calculated are included in a Domain or Area, you will see the aggregated Data Quality score and ratio in the upper right corner. There are few special rules regarding this feature, read more in the dedicated article.
Workflows
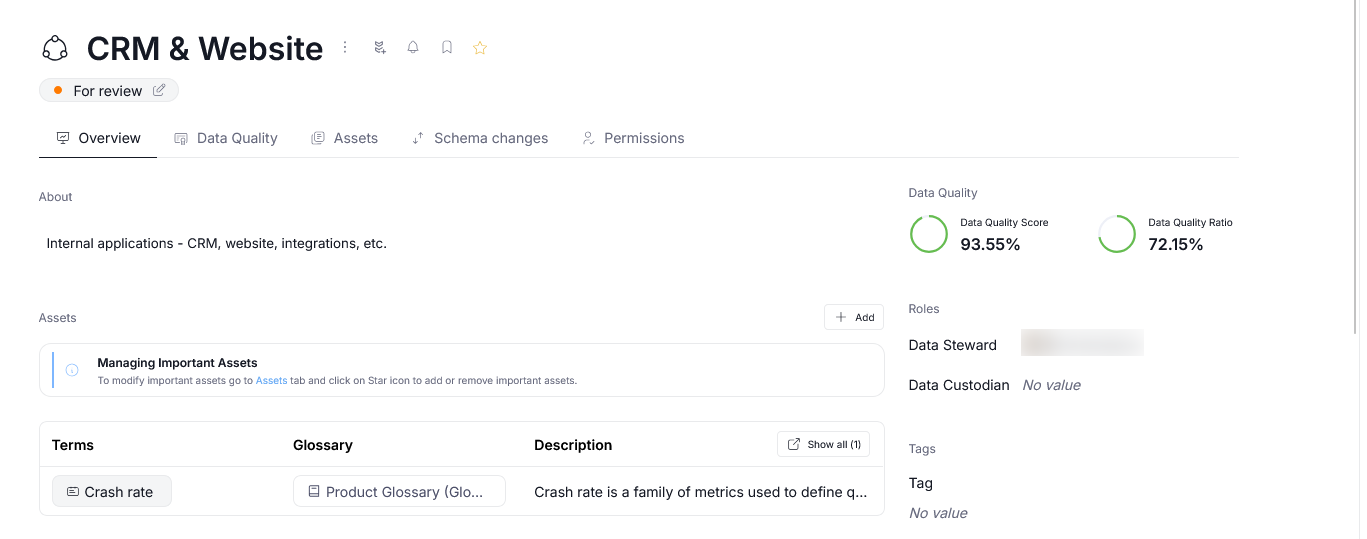
Like any manual object, Domains and Areas can be moved through different workflow stages. This allows you to streamline the road of a Domain from initial conceptualization up to its final publication to other members of your organization. Read more here.
Notifications
You can click the bell icon next to a name of a Domain or an Area to subscribe to notifications. This will make it, so that you receive notifications regarding changes and updates to all Assets linked to that Domain, as well as changes to the Domain itself (like a new Owner, or a change in description).
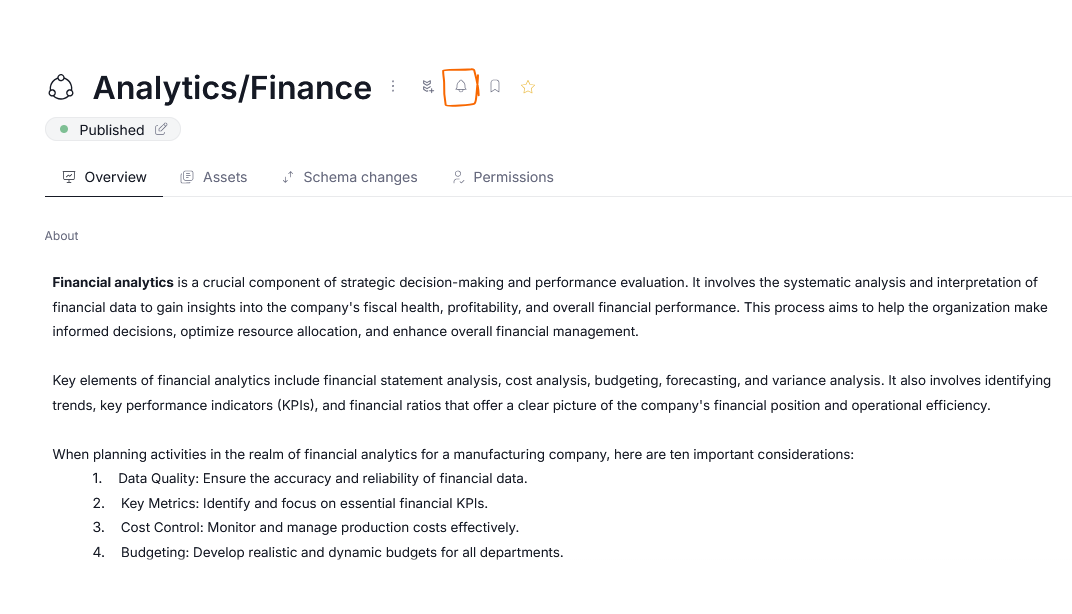
Since by default, following subscribes you to notifications regarding that object and all of its children, you will receive notifications about a Domain/Area and all of its nested Areas and their assets.
Learn more about notifications, following, and unfollowing here,
Area-exclusive tabs
Some tabs rely on showing relations between data assets linked in a smaller scope. Because of that, they are exclusive to areas, and can not be displayed in Top-level Domains.
The diagrams displayed in these tabs use only the resources stored directly in the Area as their starting point.
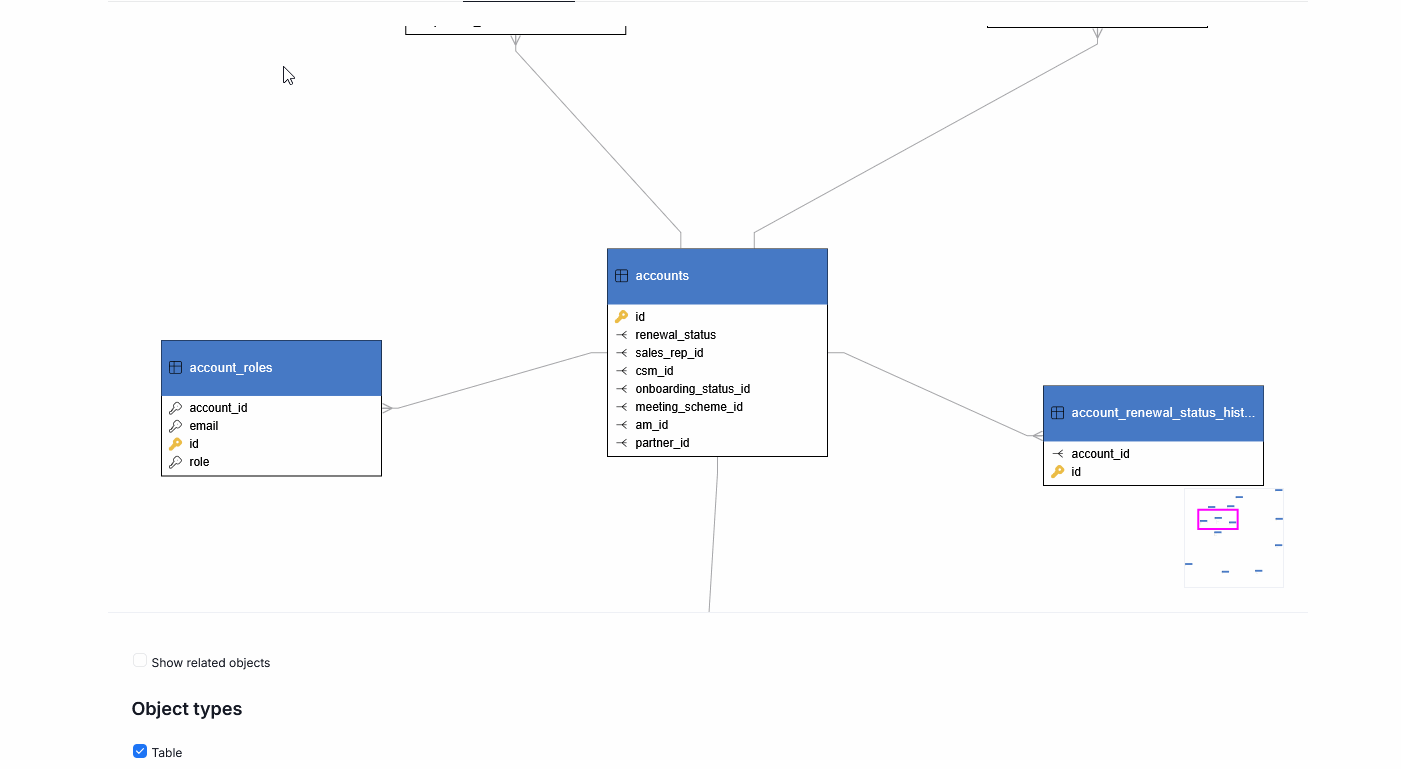
Diagrams
Diagrams are available in Areas, but not Top-level Domains. They can be viewed using the Diagrams tab. They visualize relations between objects linked to the viewed area. They are generated automatically.
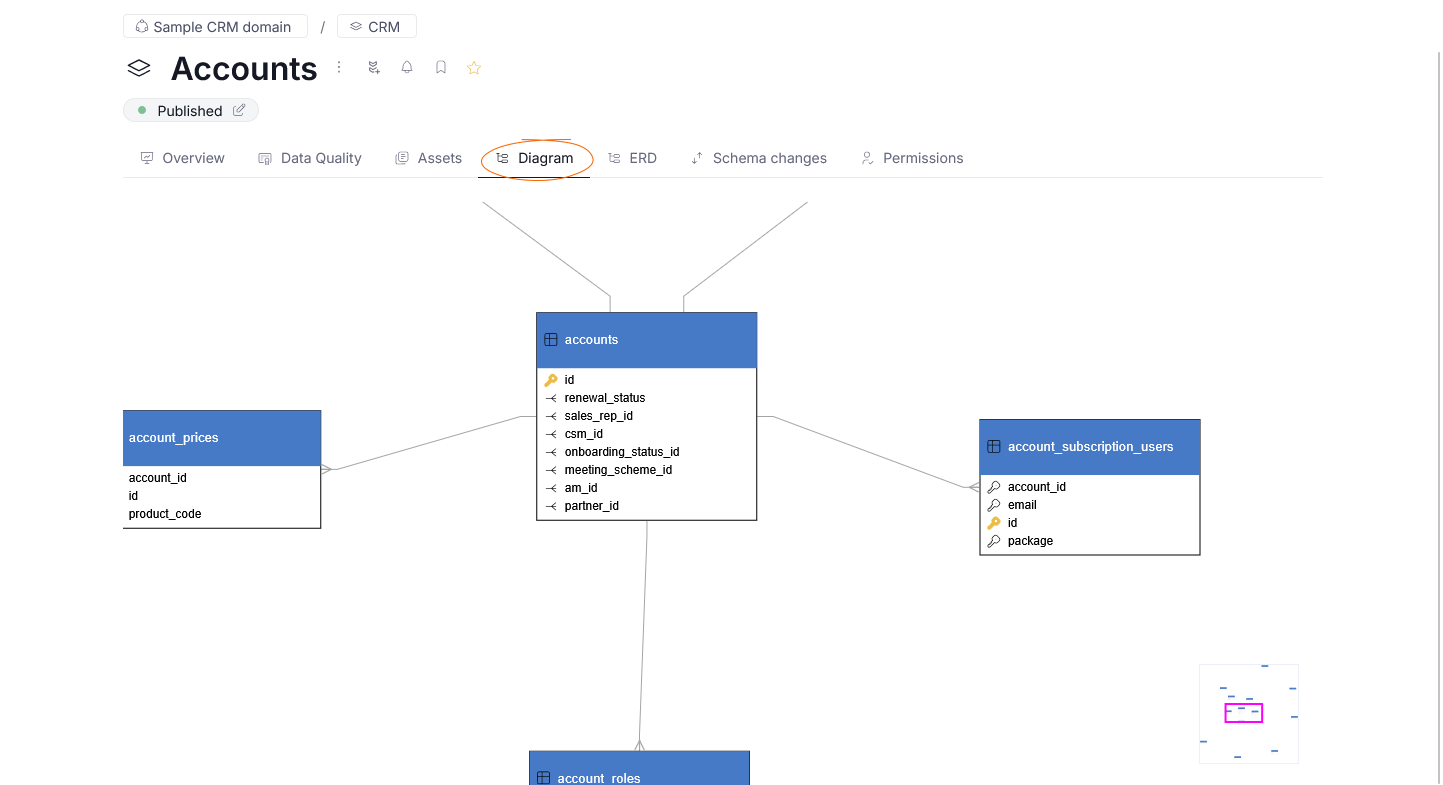
You can use the buttons below the diagram to modify what is shown.
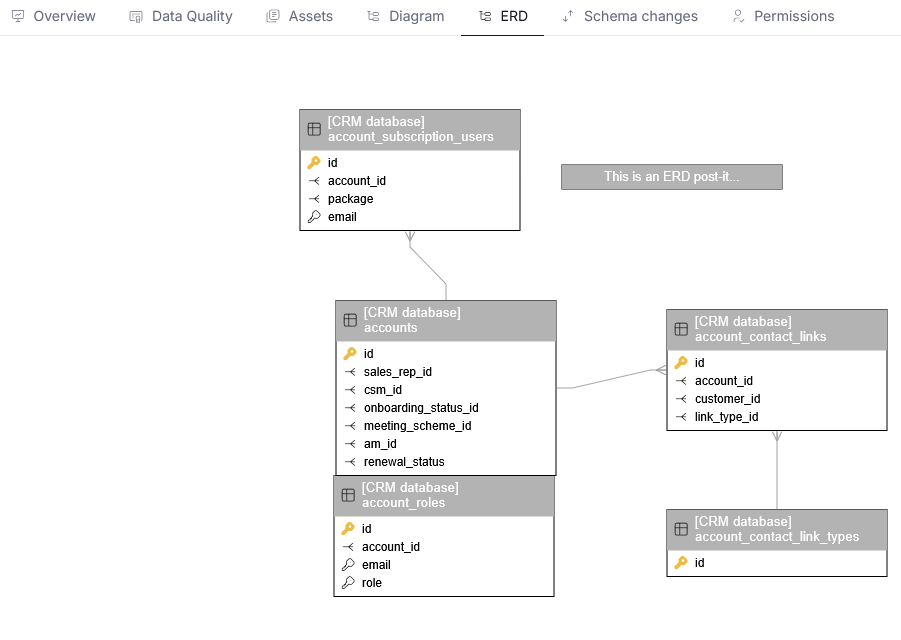
ERD
Entity Relationship Diagrams stem from the Relational Database principles. They can be viewed using the ERD tab in Areas view.
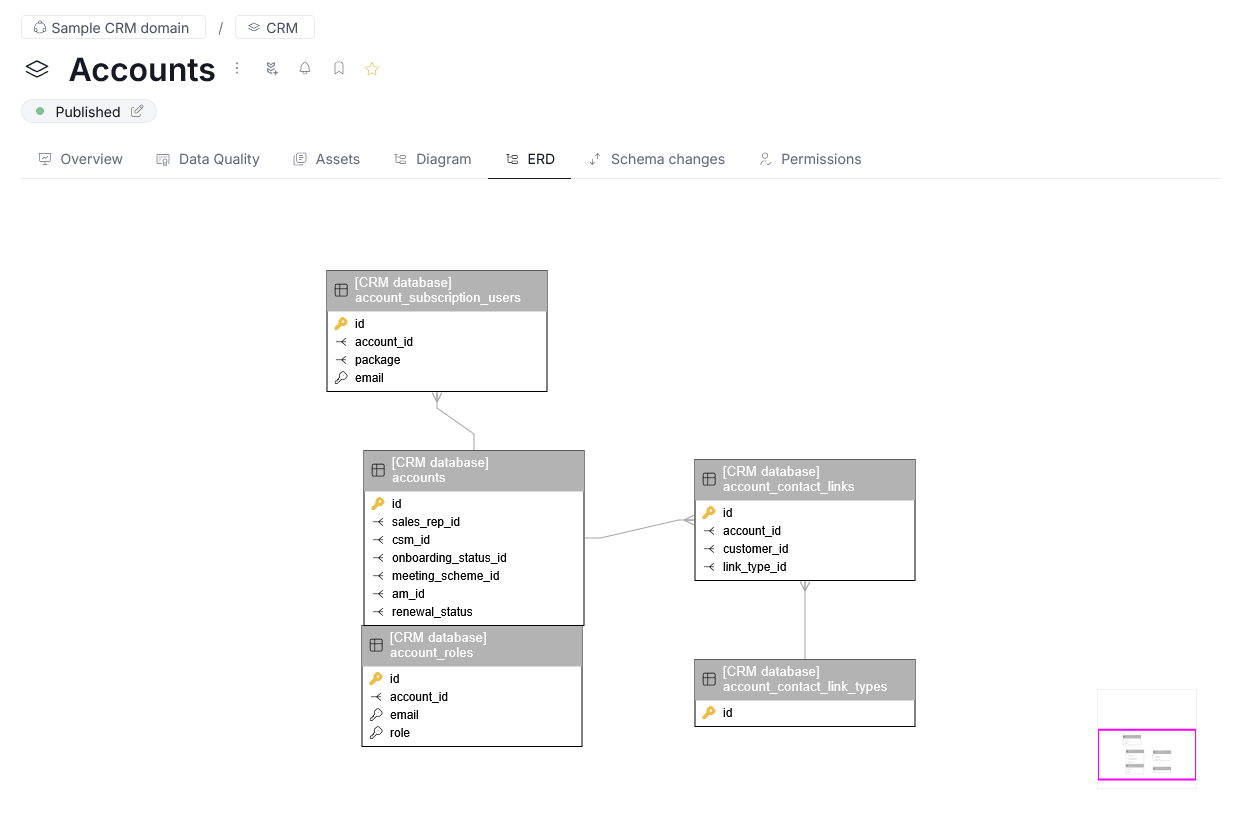
ERD diagrams are generated and edited by users in Desktop. The process is explained fully here. Once a Diagram is created it will be available in Portal as well.
Due to principles of Entity relations, diagram can contain objects outside of the Area's scope. As long as you have the permission to view them, they will still be displayed.
Other ERD features like memo cards or user comments are also preserved in the displayed ERD snippet.