Manage Data Profiling
Once you have configured global profiling settings in your repository and started running profiling tasks, you will want to manage profiling on individual assets. This article explains the tools that let you do that.
Asset profiling
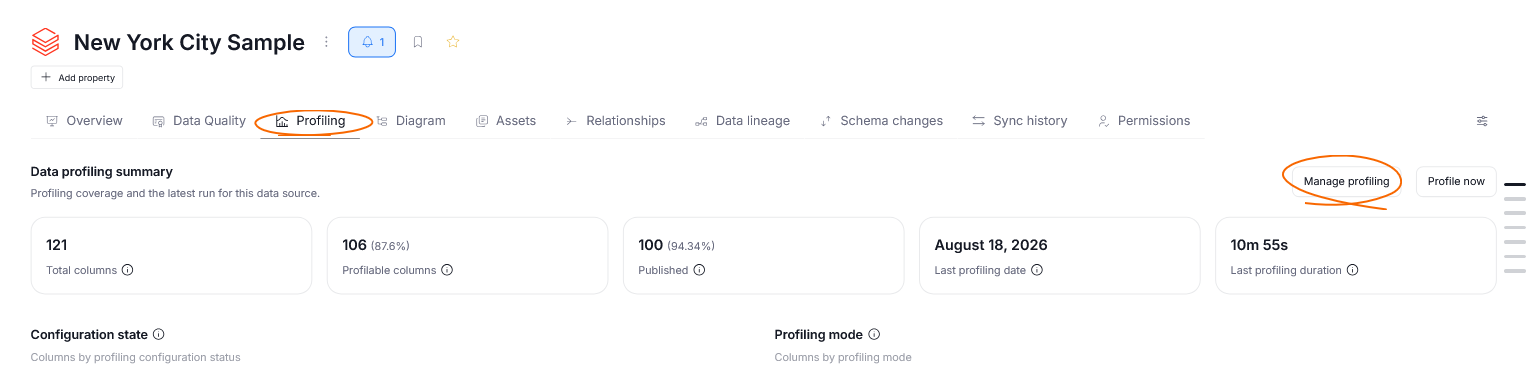
In the Data Source/Report and Table views, you can manage profiling for all child assets at once. To do so navigate to the Profiling tab and click the Manage profiling button.
This opens a grid with the profiling results for the grouped assets. The grid has three tabs: one for Published results, one for results that are still For review, and one for results that cannot be profiled because the column's data type is Unsupported.
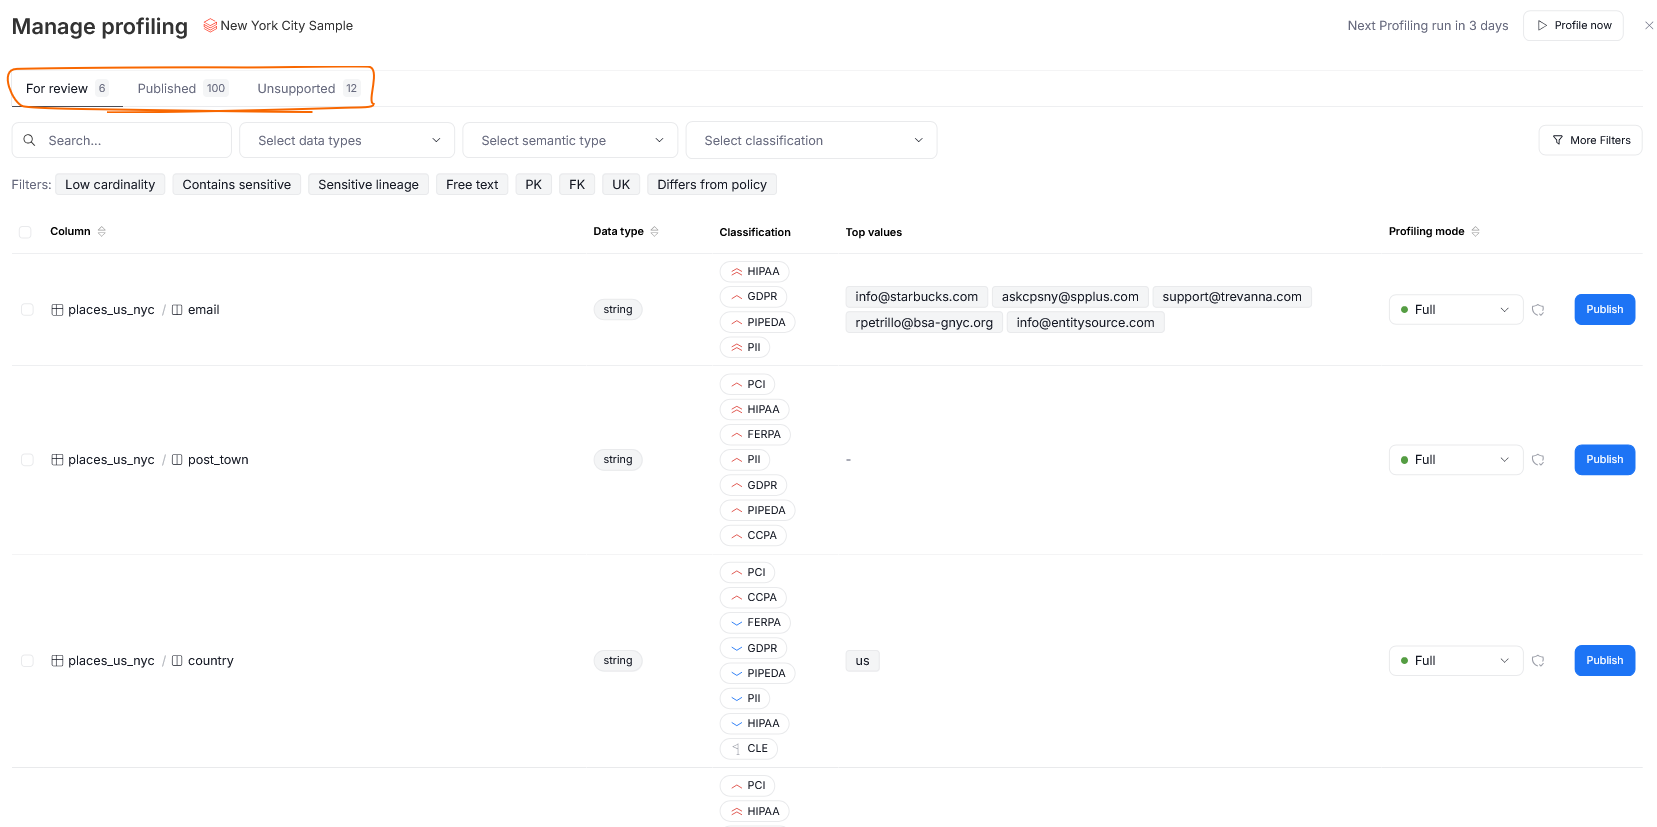
Each row corresponds to a column in a table and gives you an overview of the most important information.
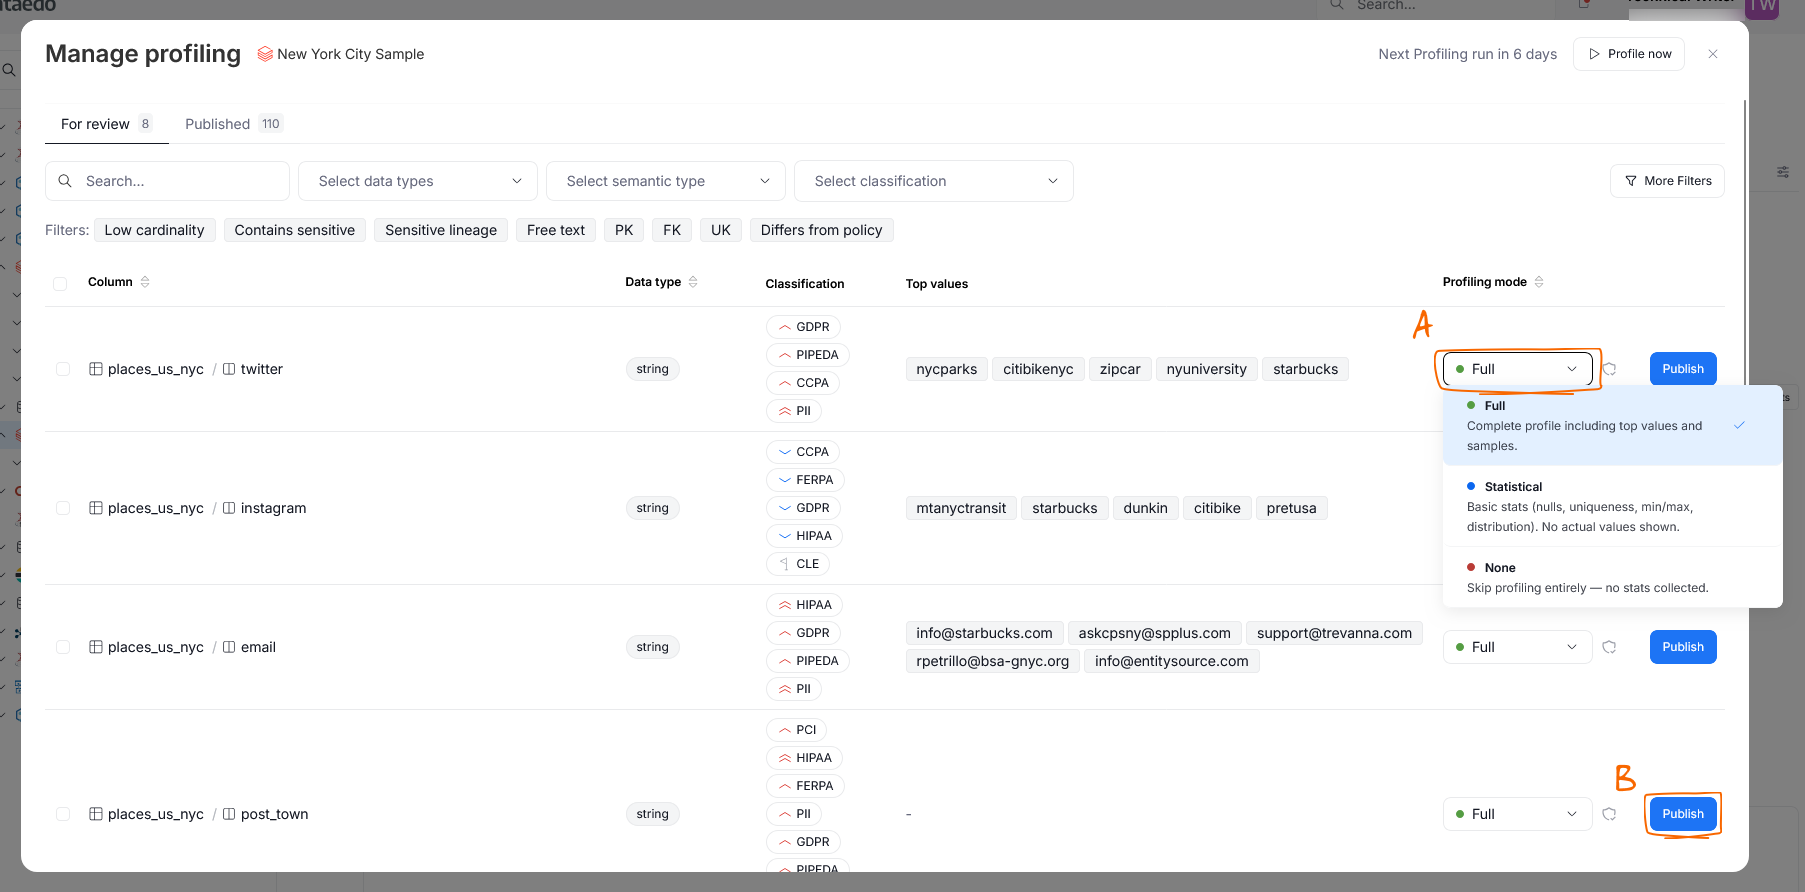
In the For review tab, you can switch a column's profiling mode [A] and choose whether to publish it [B].
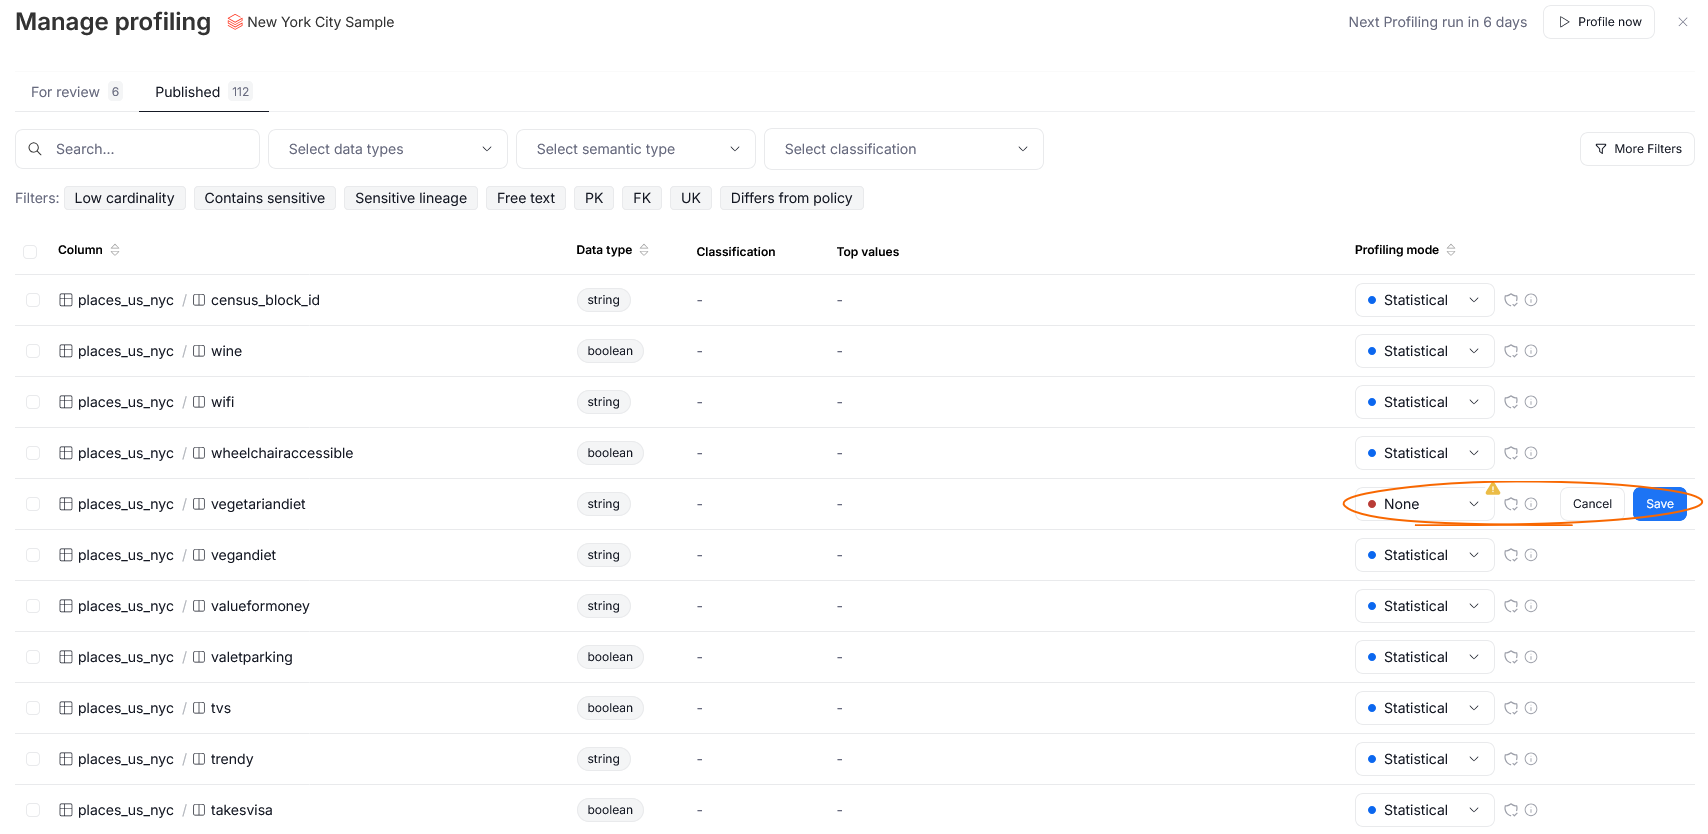
In the Published tab, you can only change the mode of already published column profiling results.
The Published tab also contains additional information regarding profiling. The badge [A] next to the mode shows who published the profiling. Automatically published results are marked with a shield, while those published by a user feature their avatar. If the mode of a published column does not match the current policy, you can hover over the Info [B] icon to see more details. When a column cannot be profiled because there is too much data, a padlock icon [C] is shown.
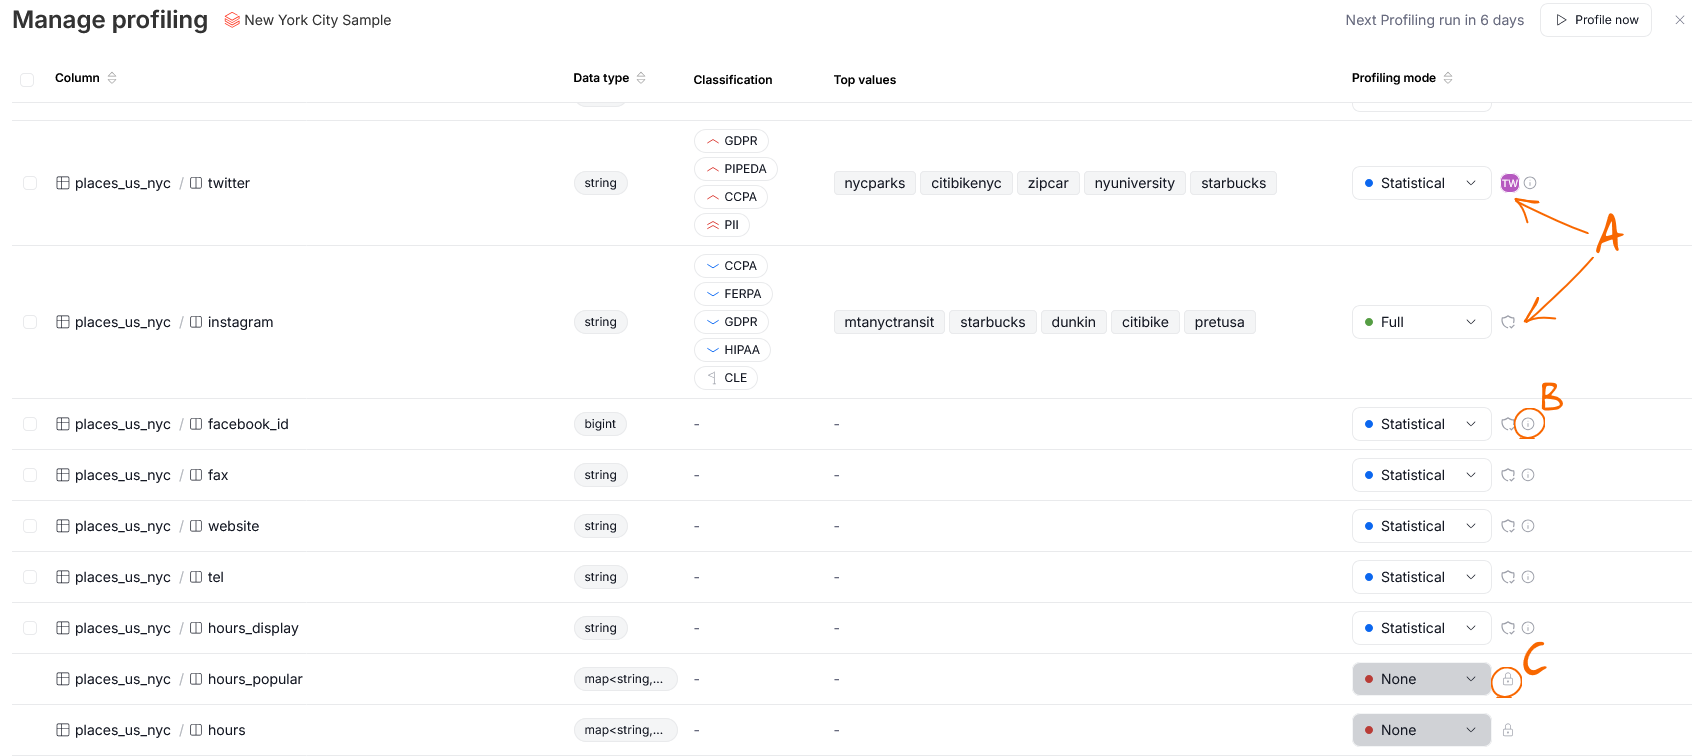
When a profiling is blocked due to data-size limits, you can override the decision through the Steward Hub.
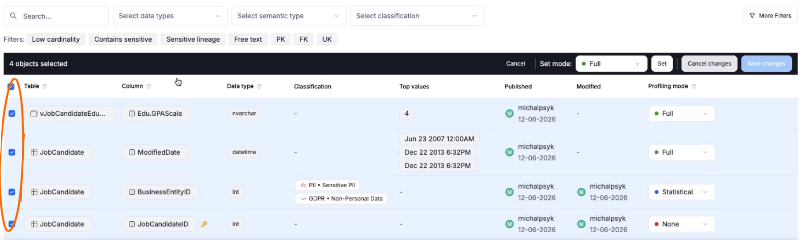
The For review and Published tabs support bulk changes. Select multiple column profiling results using the checkboxes to bring up a ribbon, where you can either publish all selected results (if they are not published yet) or change their profiling mode at once.
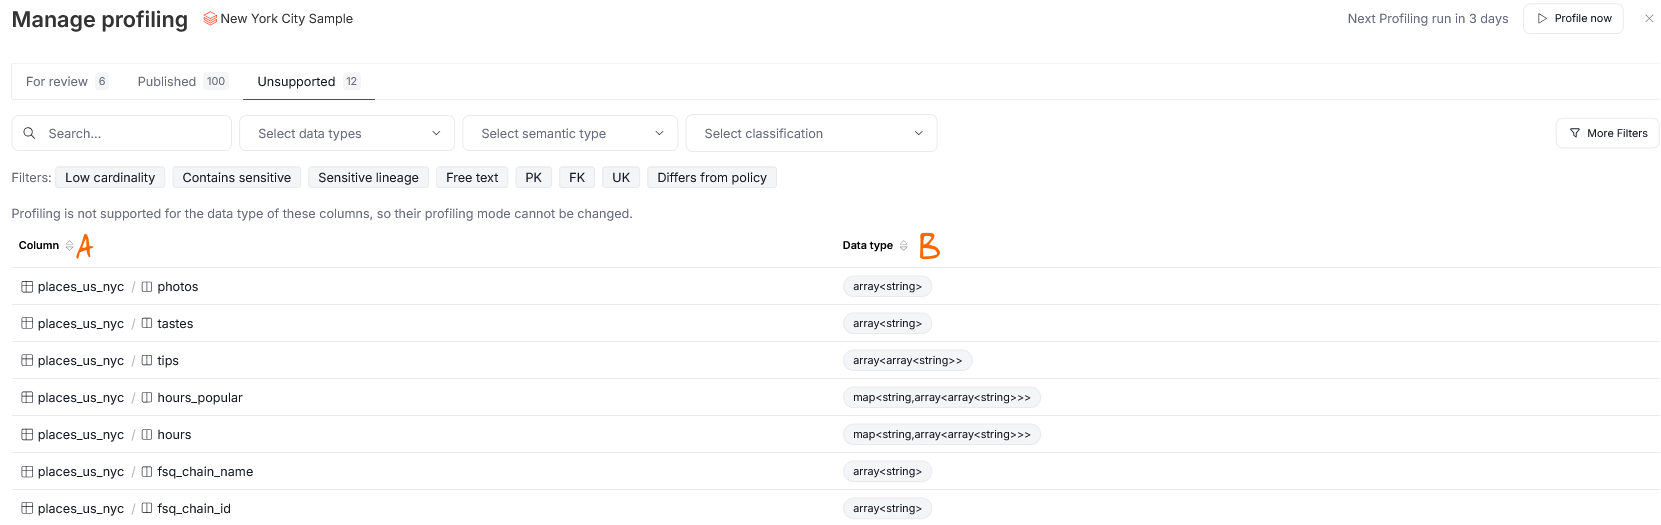
Finally, the Unsupported tab contains a read-only overview of columns that could not be profiled and will not be publishable. Each column is represented on a row, with its name [A] and data type [B] listed. A note above the grid explains that profiling is not supported for these columns' data type.
Filtering
You can use our extensive filtering system to narrow down the set of column profiling results you are viewing. This is useful when you want to target only certain columns for bulk profiling changes. The basic filtering options include a search (name matching), data type, semantic type, and data classification.
You can also access advanced filters using the filter button.
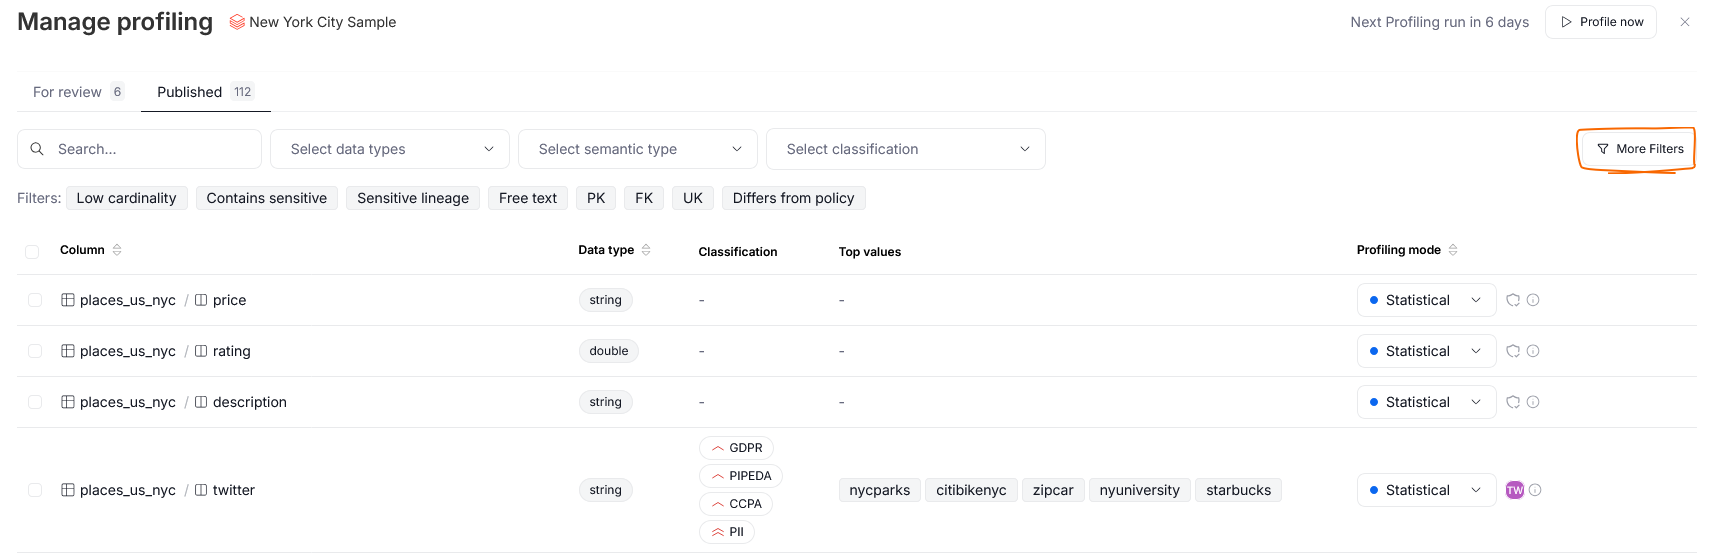
You can filter by profiling mode, parent data asset, owner, linked terms, and badges.
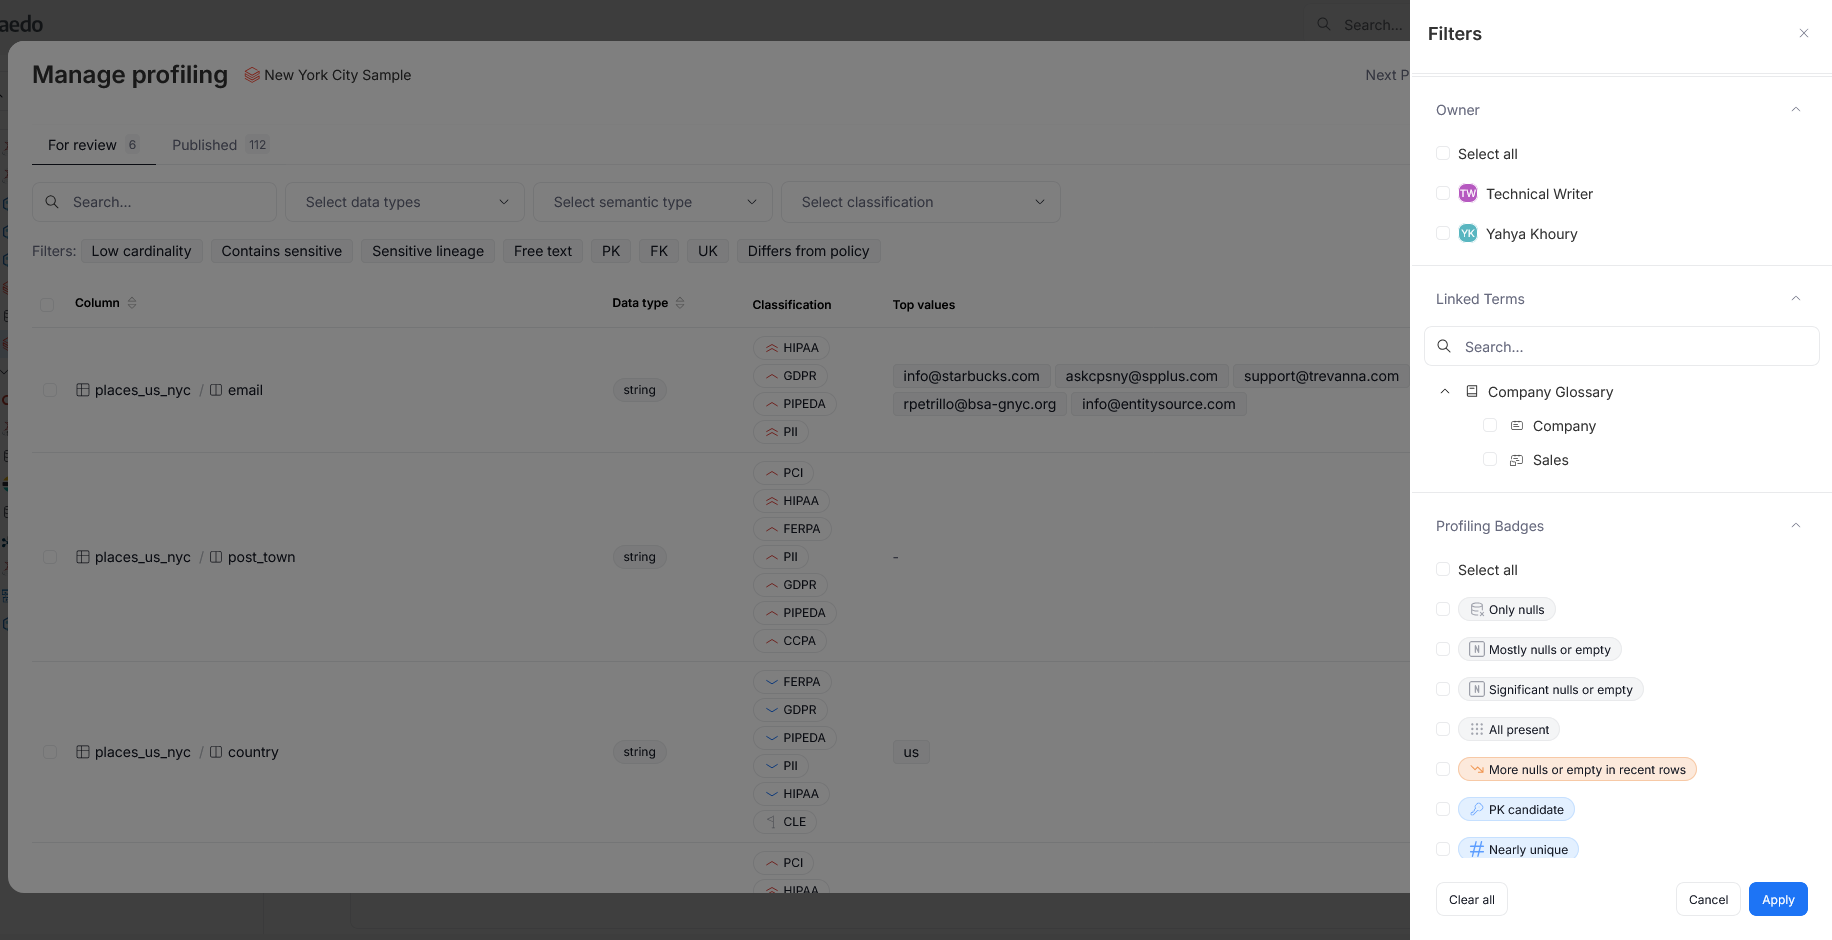
The filters are dynamic: you can only filter by information that returns a non-empty set. For example, if none of your columns have an owner assigned, you will not be able to filter by owner.
Profiling refresh
Whenever you change published profiling — either in global settings or when managing it from a data source — the new mode is not applied until the next profiling run. You can wait for the next scheduled run or trigger a task manually from the scheduler.
If you change the profiling mode directly from the data source, however, there is an easier way to trigger a run. Connection Managers will see a Run full profiling now button at the top of the grid. Clicking it reruns profiling for all columns grouped within a data source or table, with the most recent changes applied.
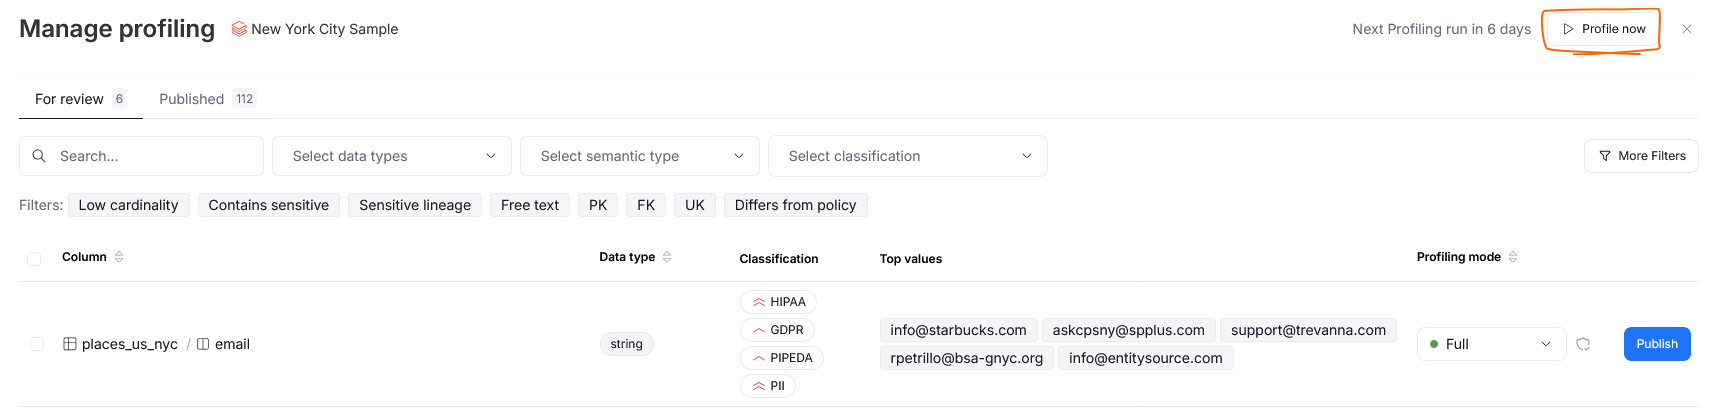
Interactions with profiling mode changes
Keep in mind that many profiling insights are tied directly to the chosen profiling mode. This means that changing the mode removes them from the repository permanently.
Information tied to full profiling — such as top values or sample data — is removed if you downgrade the mode to statistical. Even if you later switch back to full profiling, this information will not reappear until the next profiling run.
If you change the profiling mode to none, all profiling information, including history, is permanently removed. Profiling data can be recovered by simply enabling profiling and running it again, but the profiling history cannot.
Publishing profiling
If you did not enable auto-publishing, all profiling results have to be published before they are visible to the rest of your organization. As a Data Steward, you can review and publish Data Profiling results. There are three ways to do that.
In Steward Hub
The first, most efficient one is using the Steward Hub's Data Profiling module. There, you can review all unpublished profiling results waiting for your approval.
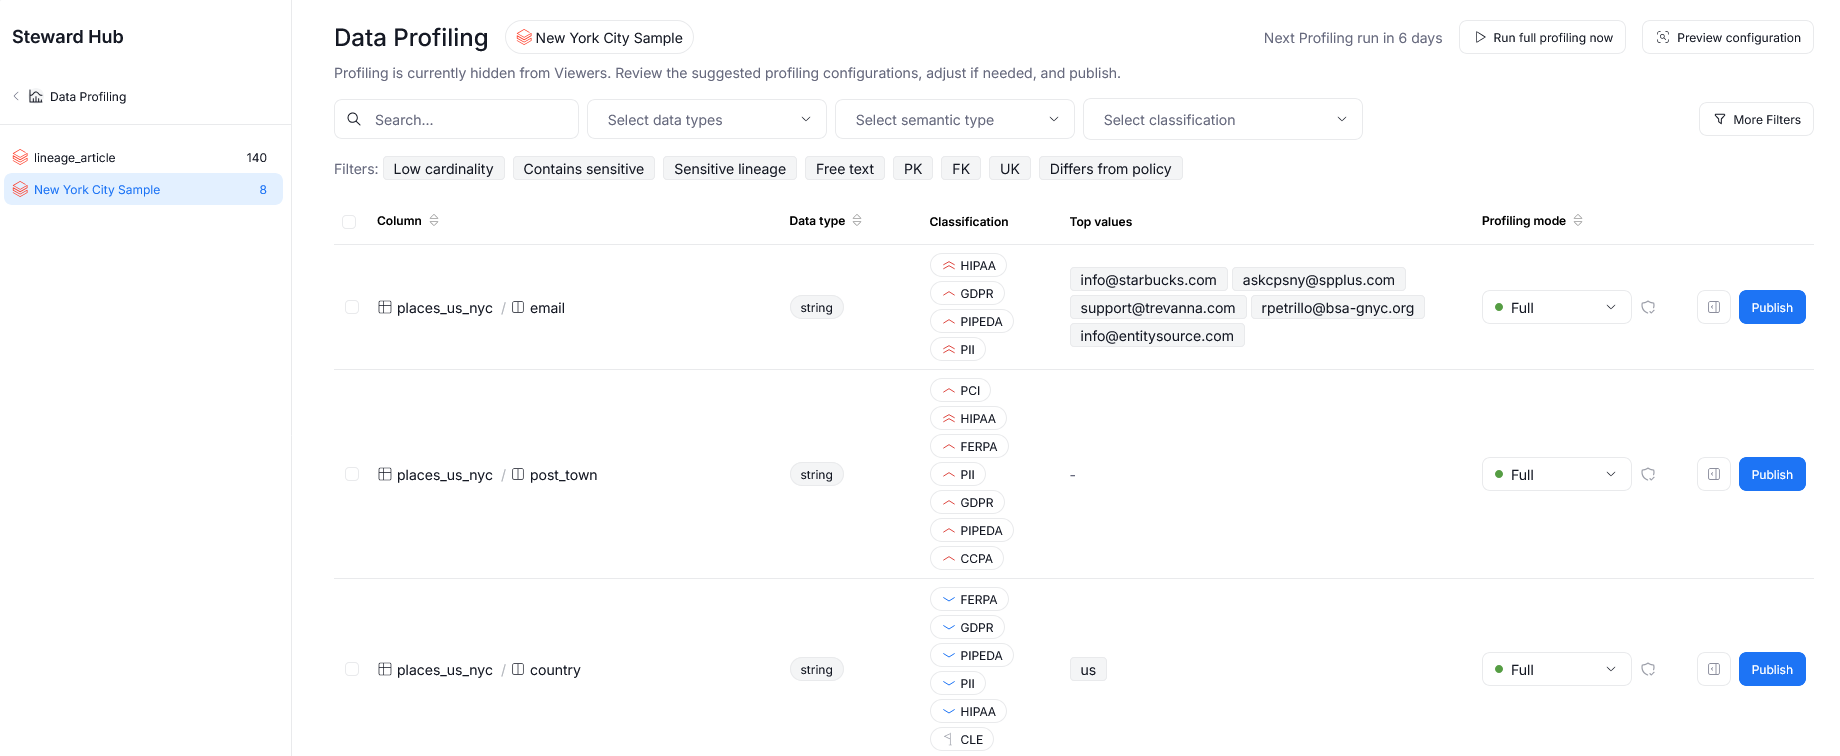
Clicking a row in the Steward Hub's overview lets you preview the profiling results quickly, without leaving the current view.
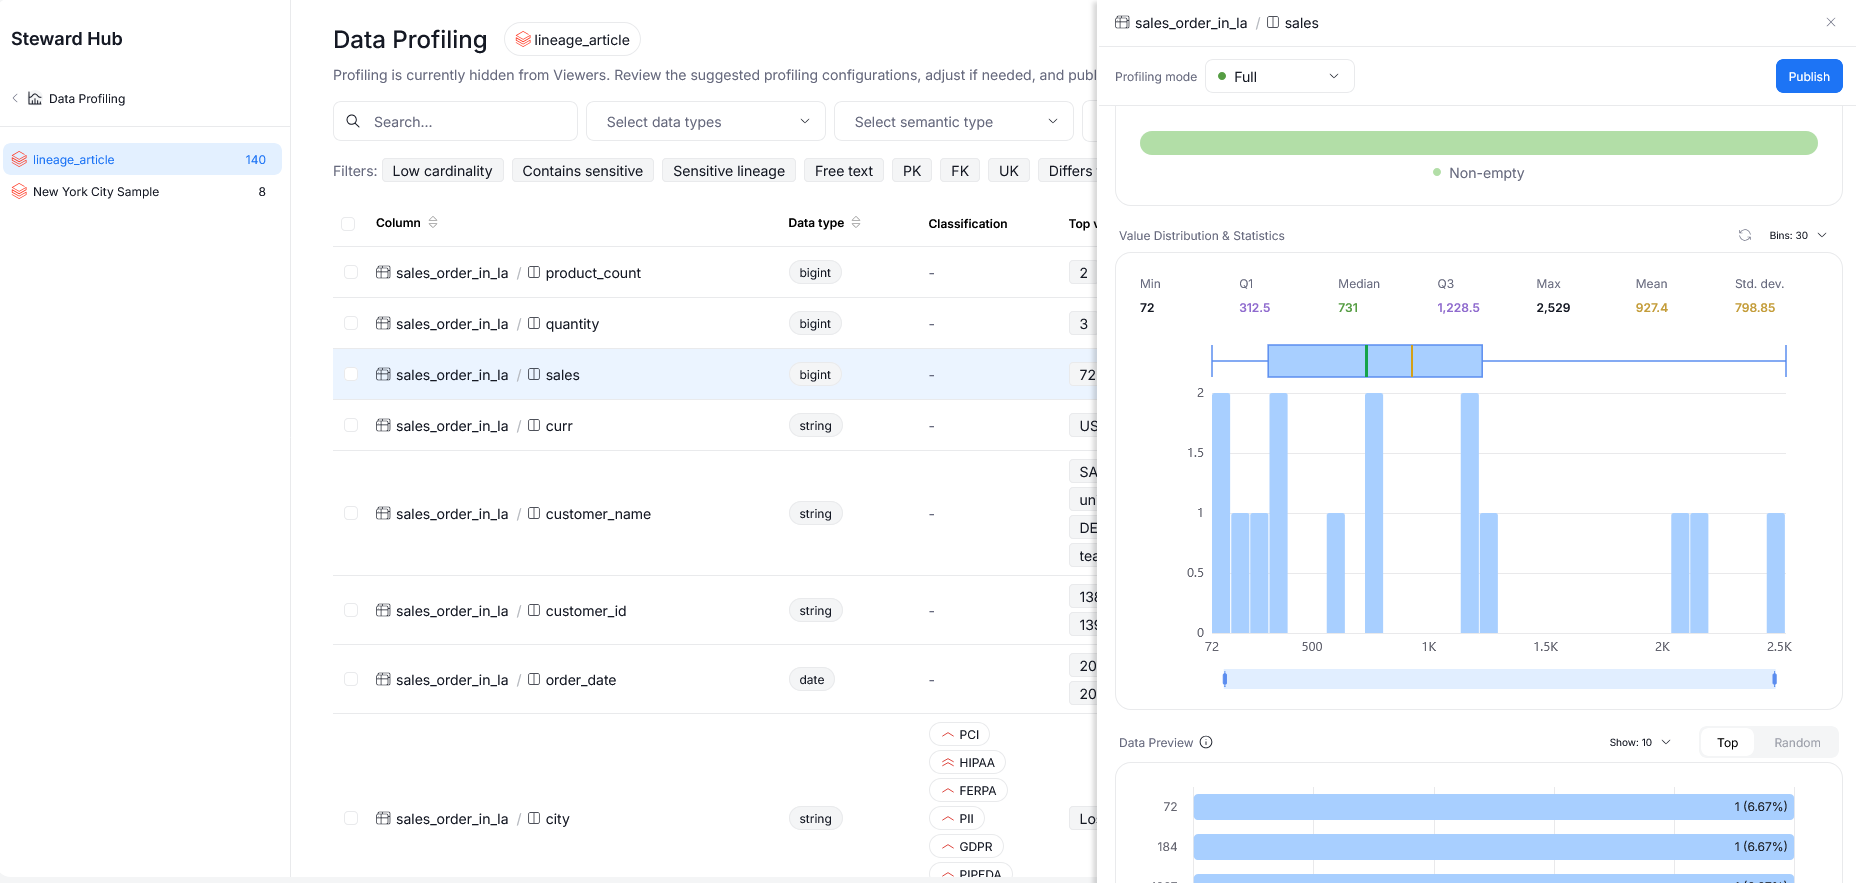
Before approving, you can decide to change the profiling mode of a column to better control information visible to users. Remember that changing the mode will also alter the results you see (for example, switching from full to statistical will hide a preview of top values from all users in the repository). This data loss is permanent — if you were to switch the profiling mode back to full, you will not see sample data until the next profiling run.
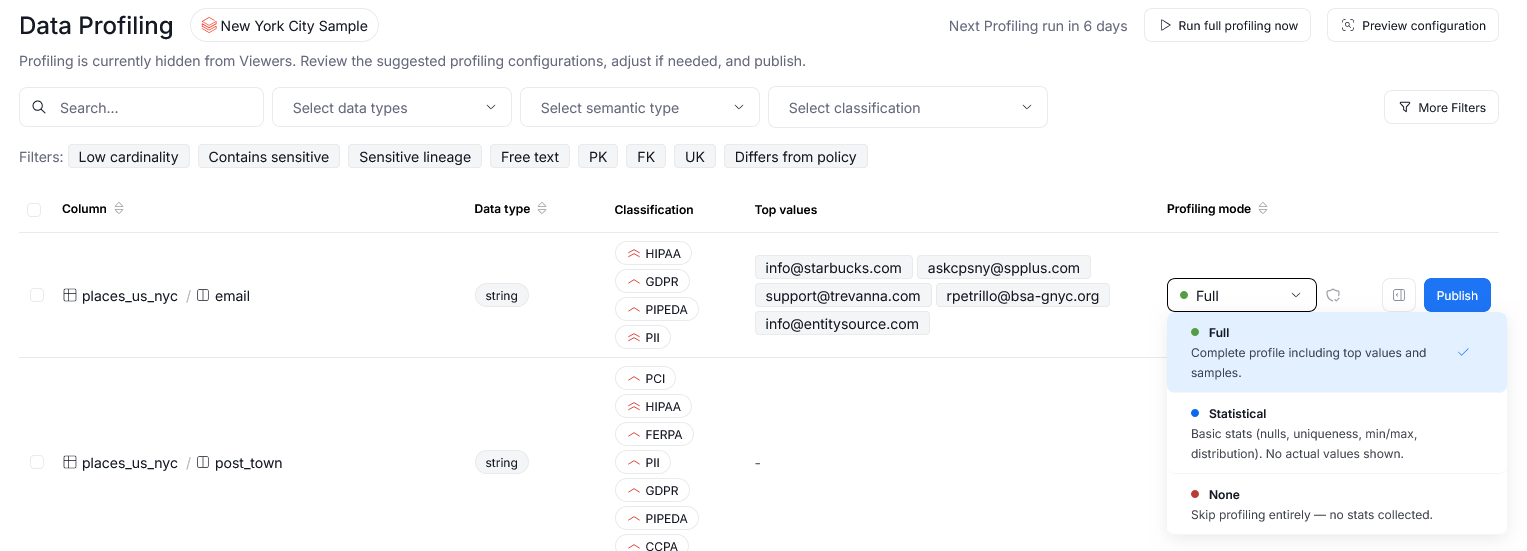
Finally, you can use the Publish button to share a column's profiling with other users.
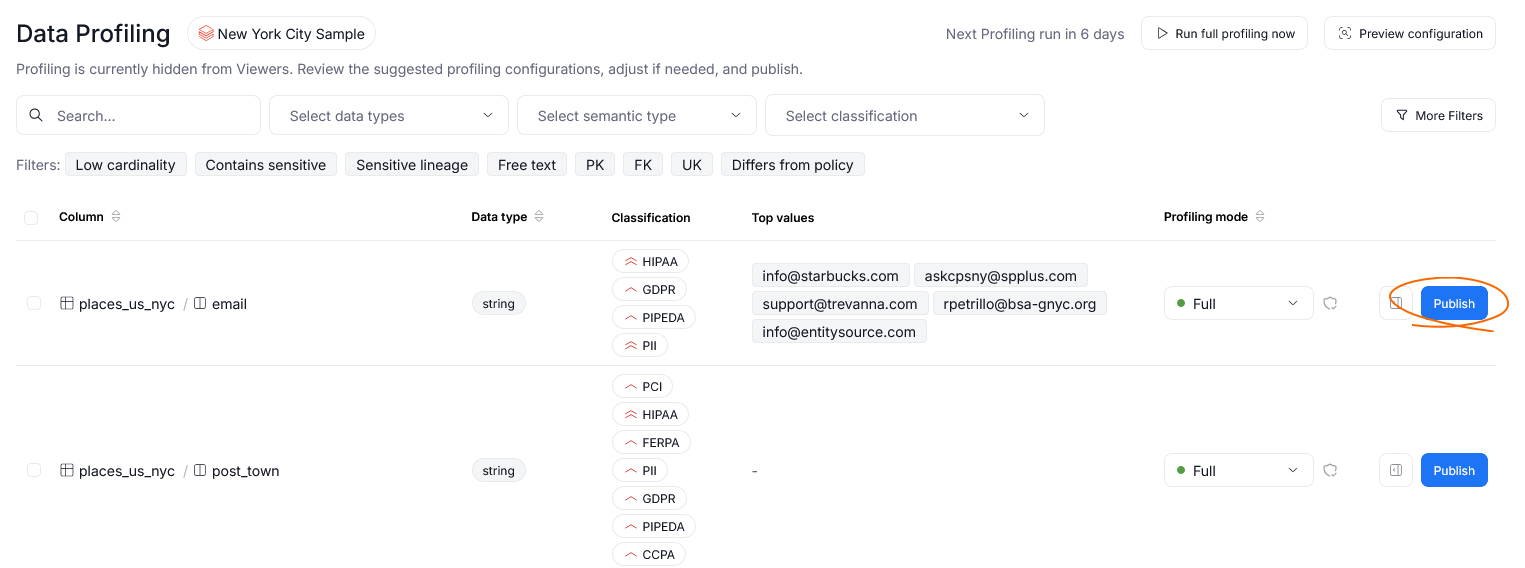
Steward Hub also lets you approve results in bulk, adjust modes, and much more. Learn more in the dedicated article.
In object overview
You can also publish profiling results directly from the object's view. To do so, head to its Profiling tab. If you are a Data Steward and profiling has not been published yet, you will see a banner letting you know that the results are yet to be made public. You can click Publish profiling for this column to share the results with the rest of your organization.
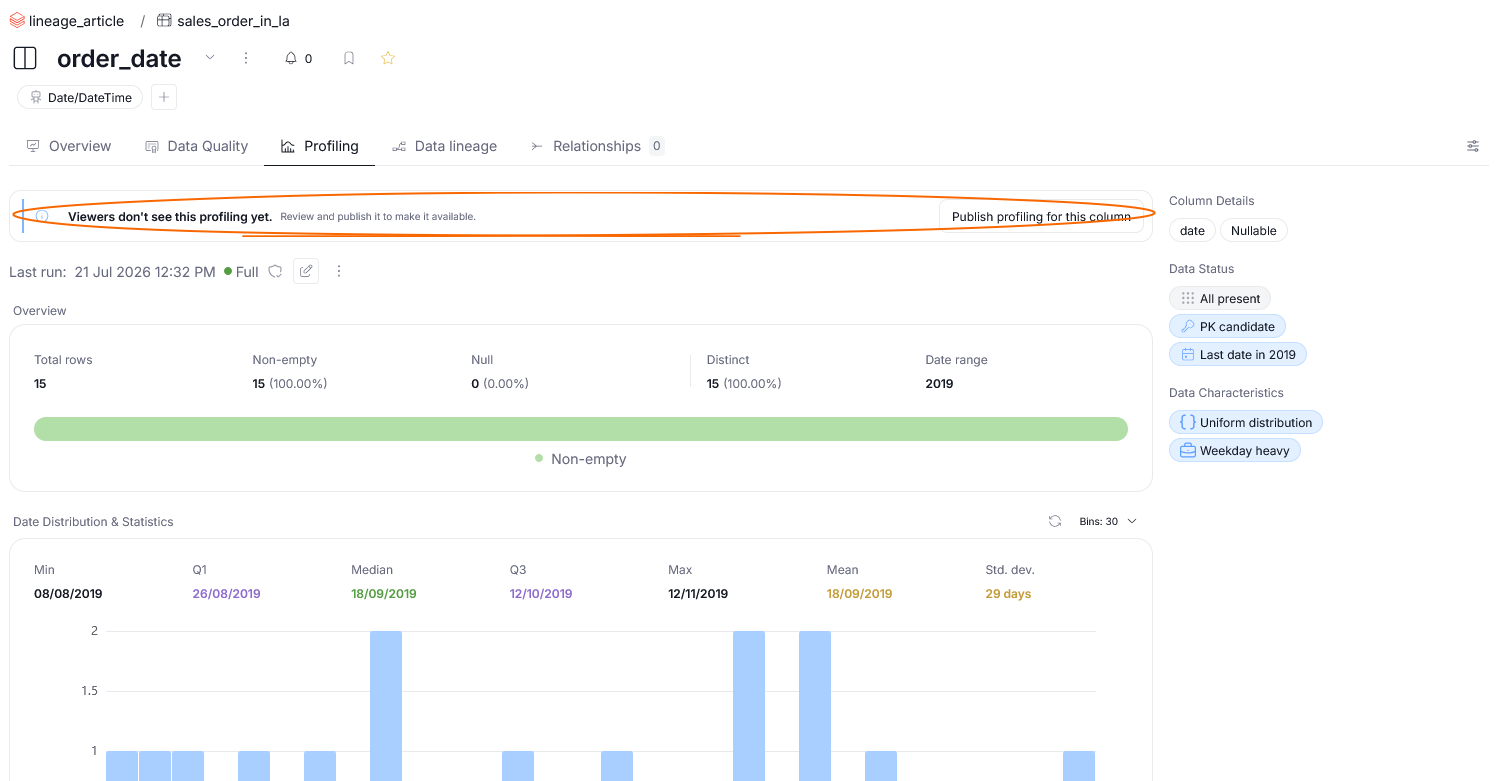
If needed, you can also change the profiling mode before or after publishing. To do so, click the Edit icon next to the dot showing the currently chosen mode.
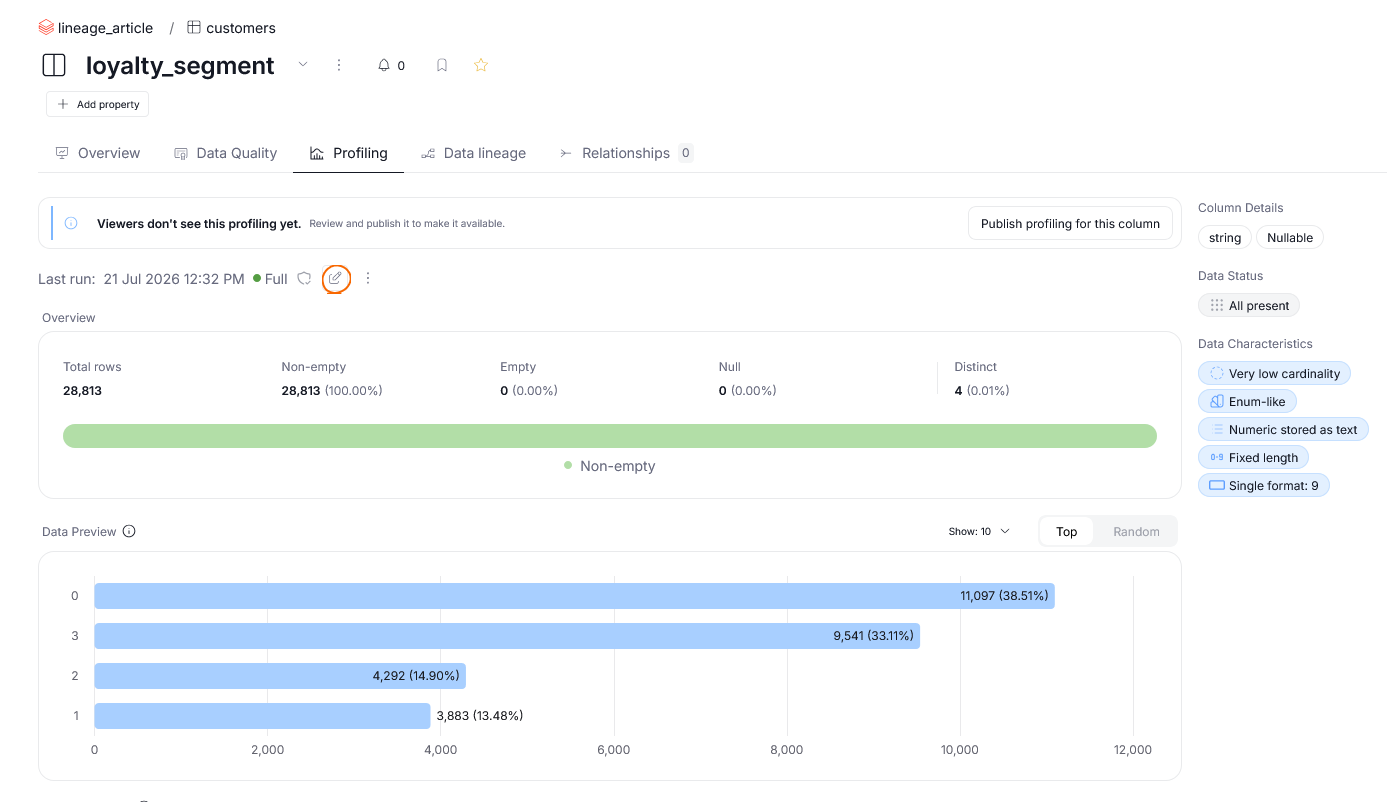
If you make changes that require profiling to be rerun (e.g., from statistical to full), the profiling results will be visible only after the next task execution. In such situations, Dataedo will ask you whether you want to run profiling immediately.
Through manage profiling
You can also publish results from the manage profiling grid described earlier in this article. In the for review tab, use the checkbox next to a row to publish a single column's profiling, or select multiple rows to bring up a ribbon and publish them in bulk.
Unpublish profiling
When viewing published profiling results (either using a profiling tab of an object, or the Published section of manage profiling), you can use the three-dot icon to open a menu that lets you unpublish the selected profiling results.
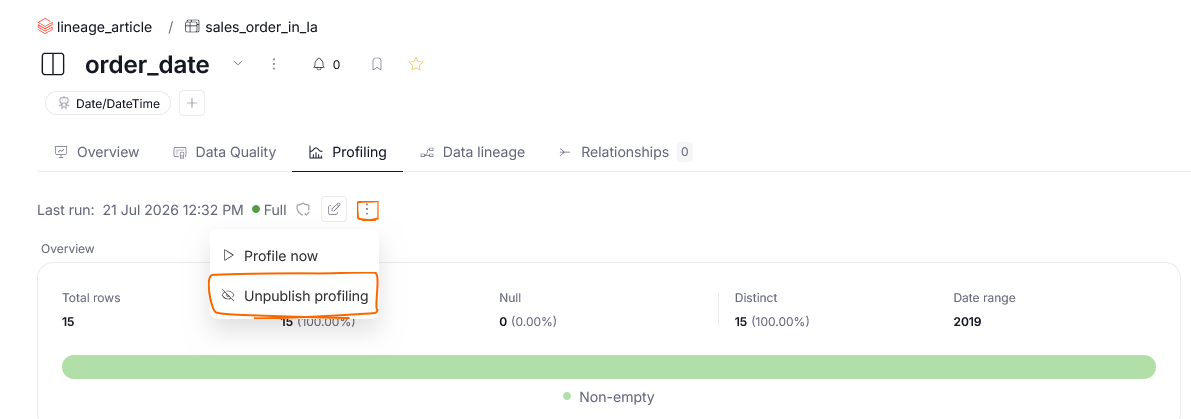
Unpublishing profiling does not delete the results. Instead, they are moved back to an unpublished state — they can still be viewed by users with relevant permissions and re-published when ready.

