Scheduling Tasks in Dataedo Portal
This guide outlines how to manage task scheduling using the Scheduler, Connections, and Credentials views available under the Connectors section in Portal.
Note that only users with the Connection Manager role can access the Connectors section and perform the actions described here.
Connectors Overview
Under the Connectors section in Portal, you can manage:
- Connections – connection configurations for Data Sources
- Credentials – reusable authentication details shared across Connections
- Schedule – task scheduling interface with logs and calendar
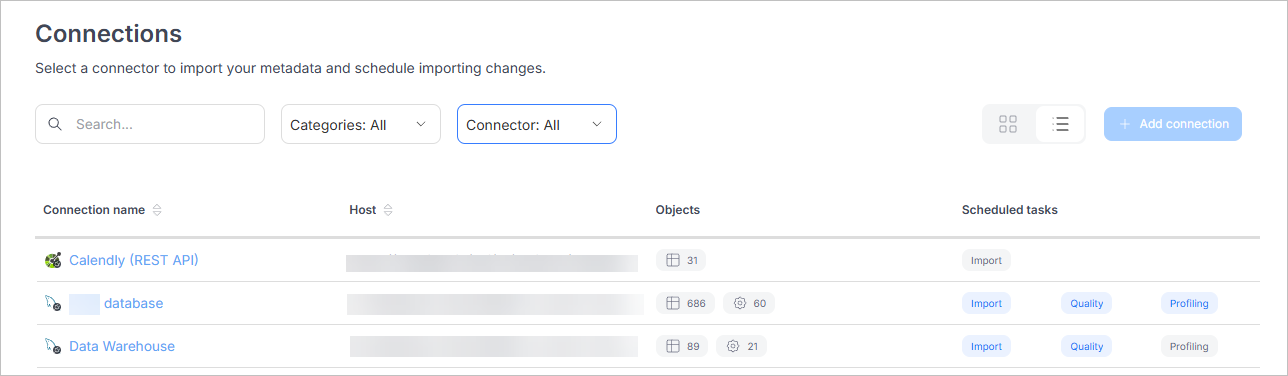
Connections
Connections group shared configuration settings like Credentials, host, and port, making it easier to manage and reuse across environments. You can also share one connection across multiple sources.
Accessing Connections
Navigate to Connectors > Connections to see all configured Connections. You can:
- view Connections as tiles or in a grid
- filter by connector type, category, or Connection/Data Source name
- search for specific Connections
- check scheduled tasks in the Scheduled tasks column
- select a Connection name to view more details
Connection Details
When you select a Connection, you can access two tabs:
- Task Planner – manage tasks for that Connection (same interface as in Scheduler)
- Settings – view/edit Connection details and manage Credentials
In the Settings tab, you can:
- update Connection parameters
- assign or create Credentials
- test the Connection to verify access
Adding a new data source
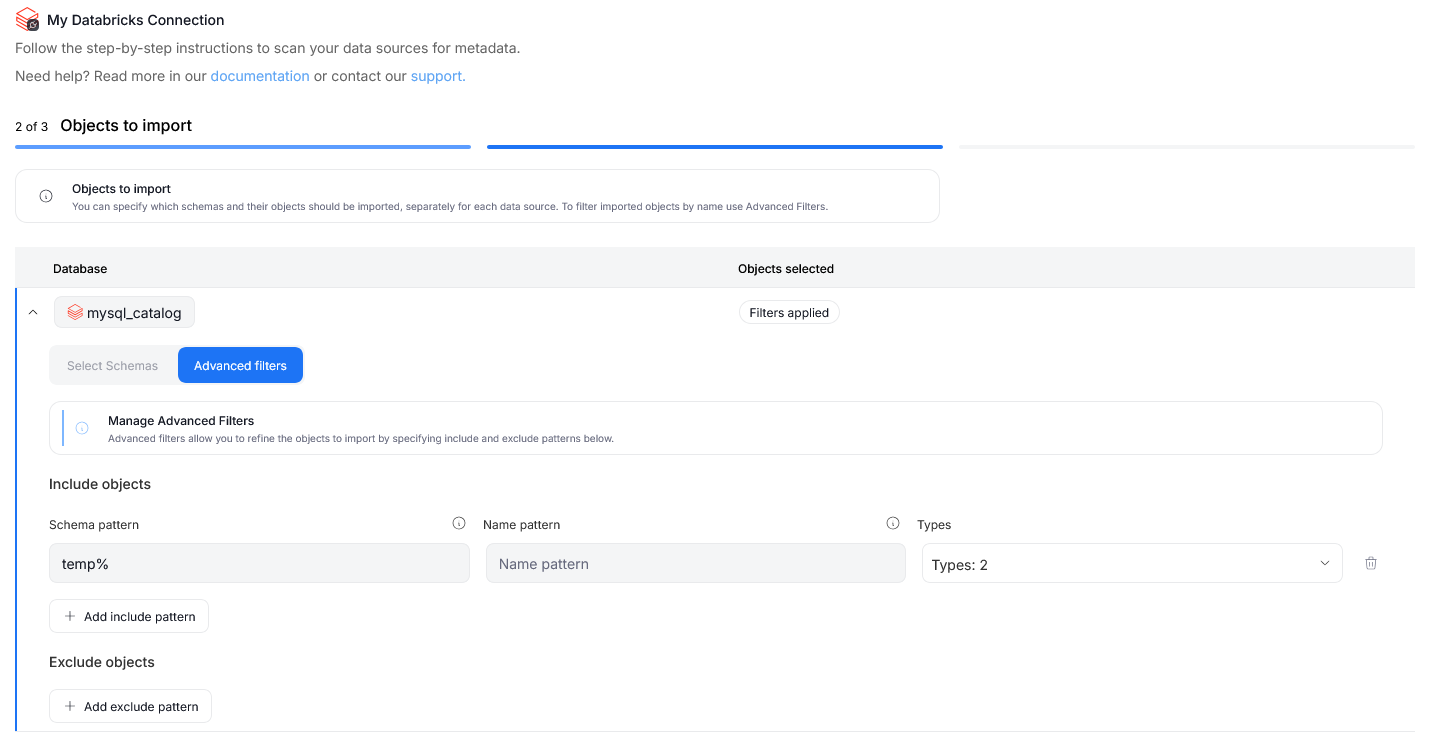
Dataedo checks whether the host your connection points to has some data sources that are not yet imported into that connection. If any are found, the Connection view will let you add those sources to the existing connection using the Add new Data Source button.
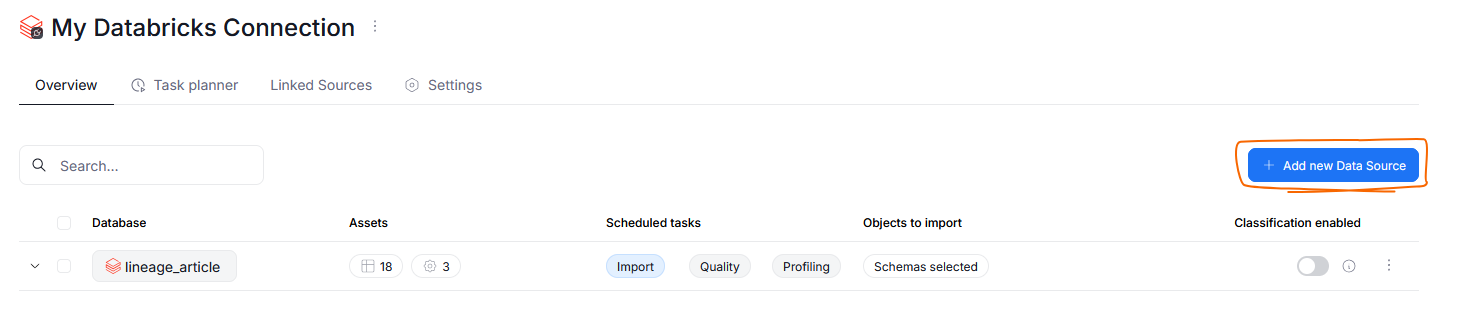
Using this button takes you through the same interface as in Importing Metadata, with the difference being that the first two steps (host details and credentials) are skipped, since those details are already stored in the connection.
Since the import steps differ slightly between data sources, you might see a different number of steps; however, you will always be asked to select the source(s) you want to import and the assets whose metadata you want to store in your repository.
Duplicate connections
To avoid redundancies, Dataedo automatically flags potentially duplicated connections. If multiple connections to the same host with the same credentials exist, you will see a warning on the Connections page.
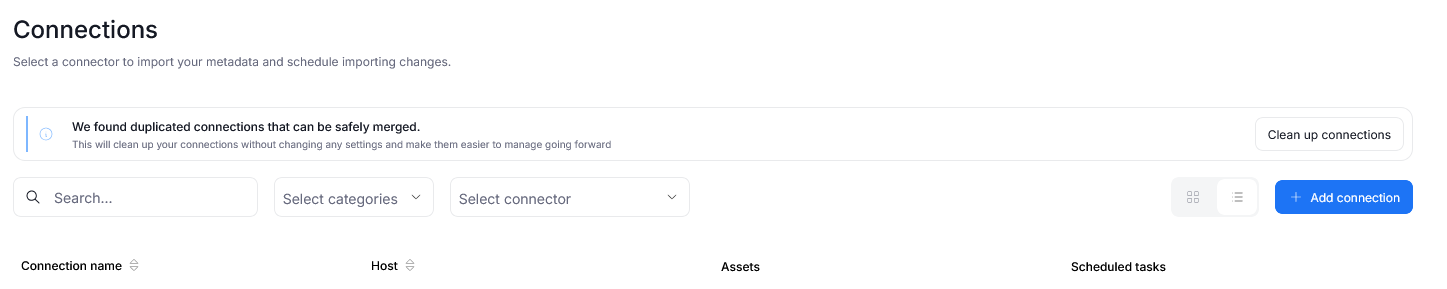
When you click the Clean up connections button, a pop-up will appear. The duplicated connections will be grouped according to their host details and credentials. This results in a list of lists, where each item represents a group of connections that can be merged. For each item you can:
- choose the name of the Connection where all the duplicates will be merged [a] (by default it is the name of one of the existing connections with the most sources linked to it)
- add an optional description to the connection [b] (by default, it will be pre-filled with the descriptions from all merged connections)
- choose to not merge the connections [c]
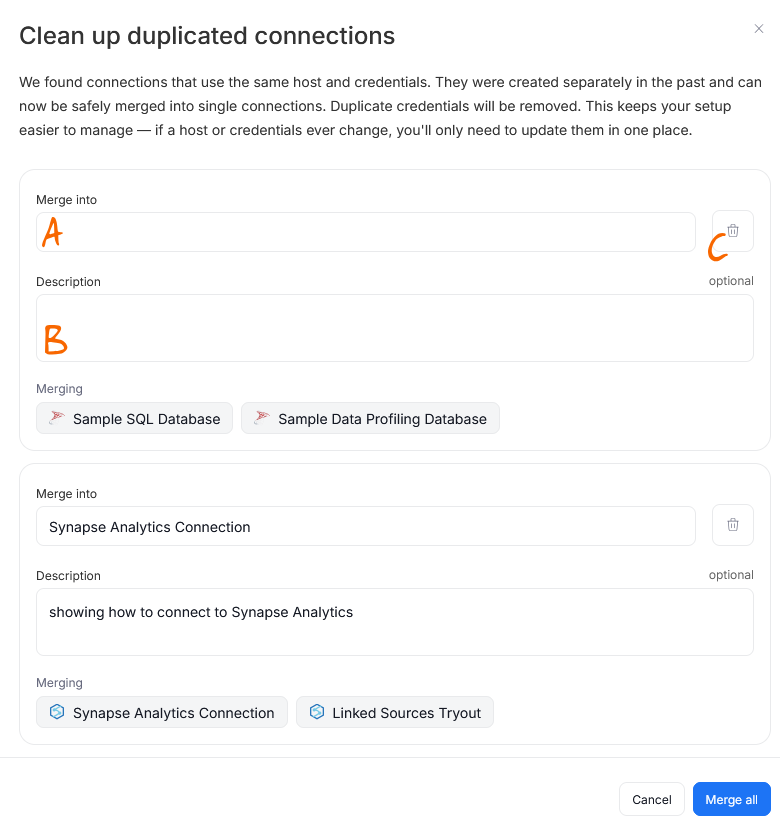
Finalize your choices using the Merge all button. The duplicated connections will be merged into one, selected connection and then deleted. This leaves you with a single connection holding all your data sources from a given database.
Keep in mind that if the duplicate connections were associated with assets that you documented (e.g., by adding a description, Badges or Custom Fields), the assets' documentation will be retained after the merge.
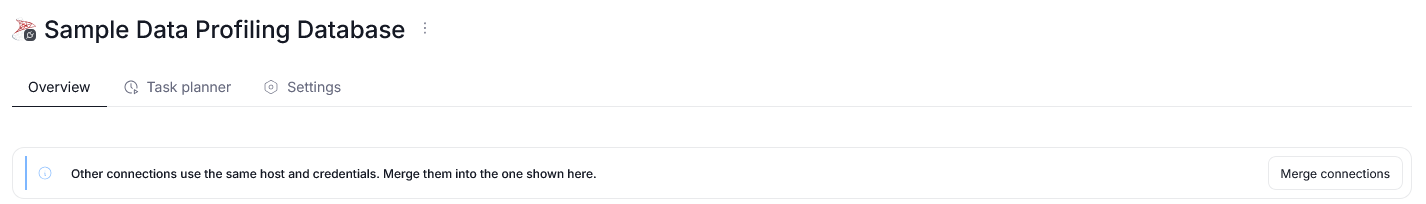
You can also merge duplicated connections directly from a Connection's page. In this case, the process will be the same, but the merge pop-up will contain only connections that link to the same host as the currently viewed one. So, if you were viewing a Connection to SQL Server, and you were to click the merge connections button there, you would be shown only other SQL Server connections pointing to that same host.
Scheduler
The Scheduler is available under Connectors > Schedule and consists of two main tabs:
- Task Planner – create and manage scheduled tasks.
- Calendar – view task execution history and upcoming executions.
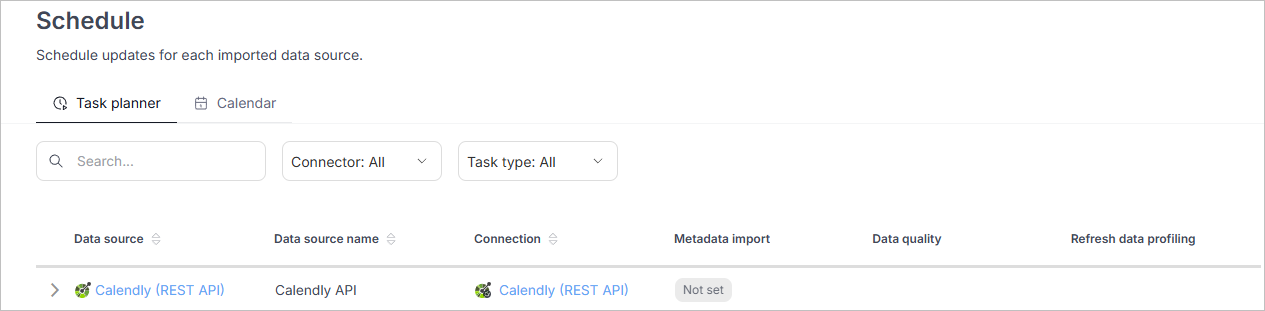
Task Planner
Use the Task Planner tab to schedule, edit, delete, or run tasks for your Data Sources.
Features
- tasks are grouped by Data Source
- filter tasks by connector or task type
- use the search bar to find tasks
Task Status
- Active – the task will be executed according to its schedule.
- Draft – the task will not be executed until manually activated.
To Schedule a Task
- Select the Data Source.
- Click the scheduling button on the right.
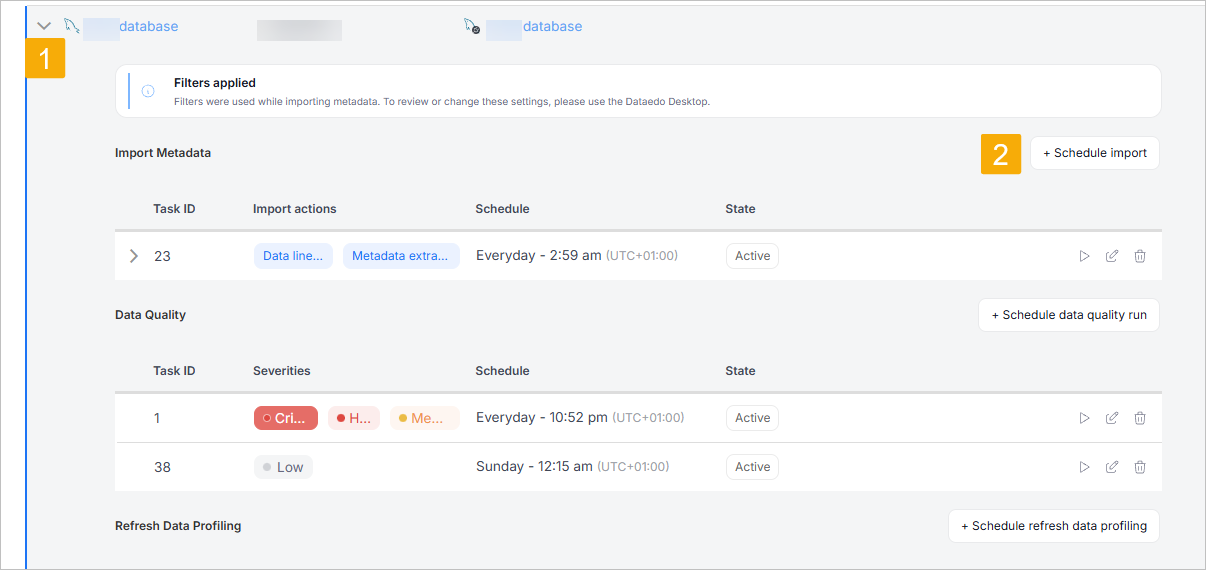
You can specify:
- task type (for example, Import, Data Quality, Profiling)
- execution frequency:
- daily at a specific time
- specific days of the week
- specific days of the month
- status: Draft or Active
Note: Tasks use the creator's local time zone for scheduling, but are displayed in UTC in the interface.
Limitation: Tasks requiring Browser login cannot be scheduled.
To schedule multiple tasks
You can also schedule tasks for multiple sources at a time. Use checkboxes to select all the sources you want to schedule. A Schedule button will appear above your Data Sources grid.
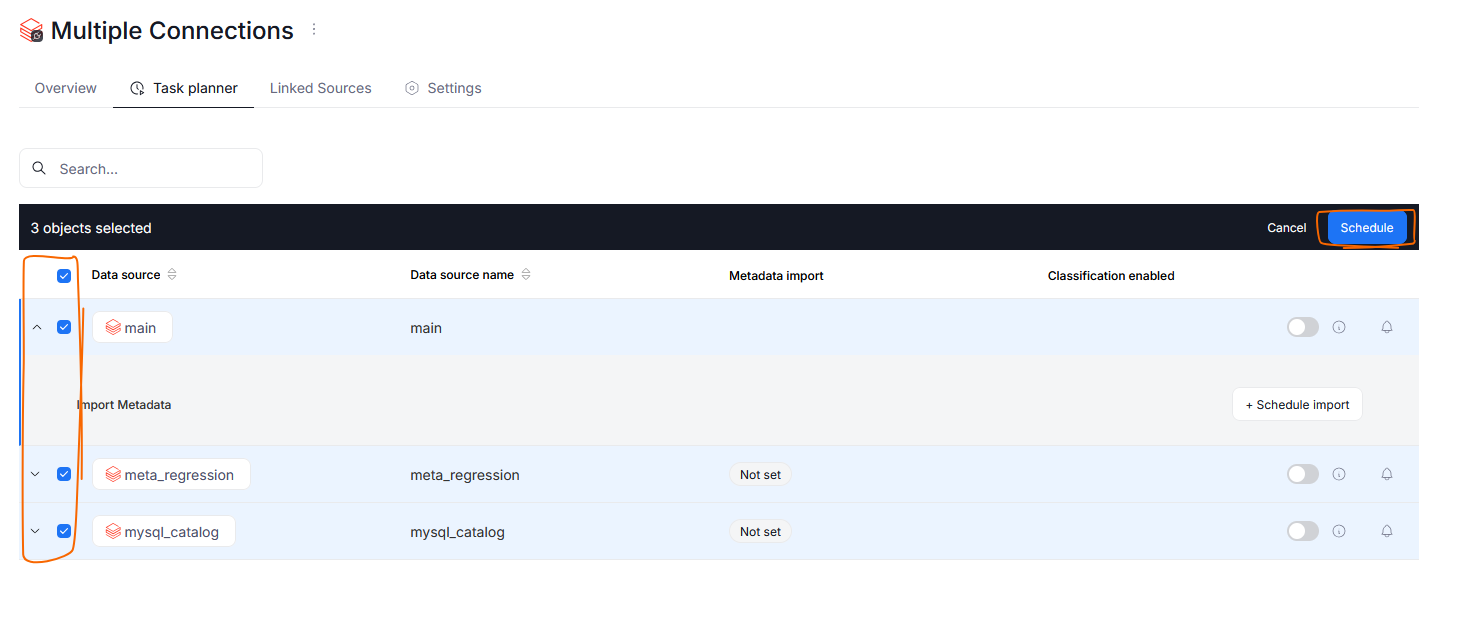
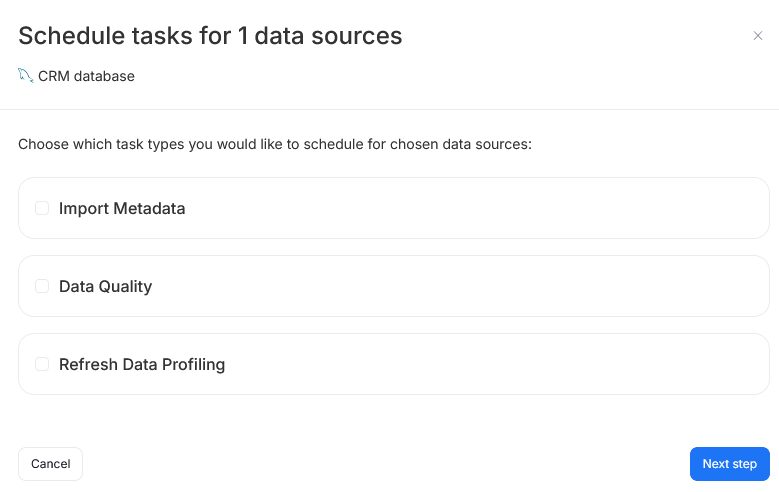
Once you click it, a popup appears. You have to select what type of tasks you want to schedule. The displayed options depend on tasks that are supported for your selected Data Sources. If only one type of task is possible for your selected source, this step is skipped.
Next, a task scheduling setter is displayed. The number of steps depends on the number of tasks selected in the previous step. You can schedule all task details and parameters as you would normally.
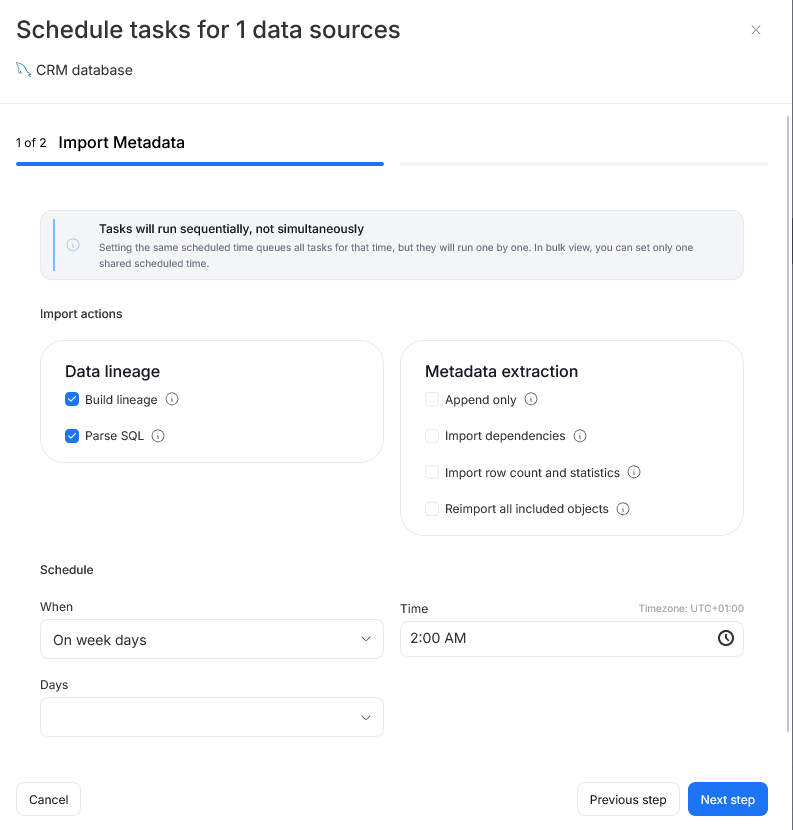
One thing to keep in mind is timing. You are asked to select the date and time when task executions will run. If scheduling multiple tasks for the same time, they will run sequentially, not simultaneously.
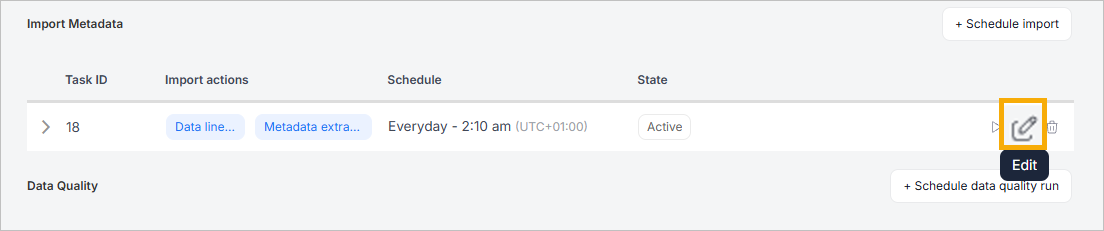
To Edit a Task
- Locate the task.
- Click the Edit icon in the task row.
- Modify task settings and save.
To Immediately Execute a Task
- Find the task.
- Click the Trigger now icon.
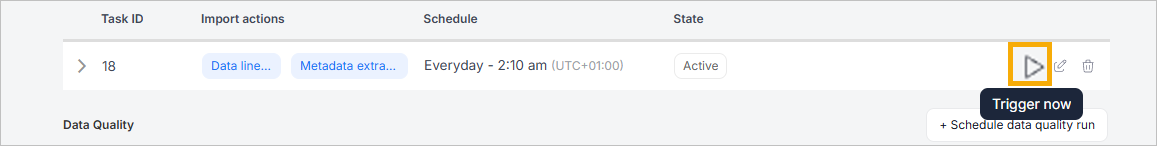
Note: The task will be added to the queue immediately, but actual execution may be delayed. The Agent can only process one task at a time and must finish the current task before starting a new one.
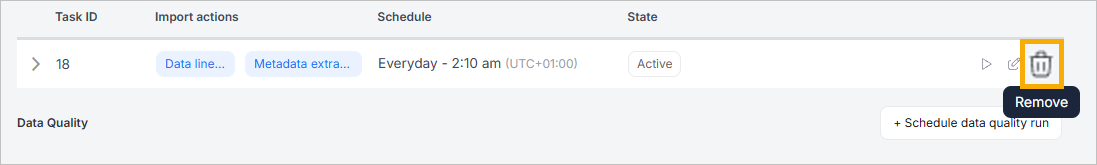
To Remove a Task
- Find the task.
- Click the Remove icon.
Warning: Not all Data Sources support Data Quality or Data Profiling tasks. These task types will not be available for unsupported sources.
Metadata Import Timeline
Metadata Imports are divided into 7 steps, giving you better insights regarding which process is actually taking place. This can also help with troubleshooting. If your Import fails, you can check at which step the crash happened.
These steps are:
- Schema Extraction
- Schema Loading
- SQL Parsing
- Lineage Extraction
- Building Lineage
- Extracting Tables Statistics
- Finalizing
Each step provides an overview of statistics — current level of completion, time elapsed on the current step, and number of scanned objects.
Schema Extraction and Loading, as well as Finalizing cannot be interrupted, as they are necessary for the metadata to appear in your repository.
All other steps can be cancelled. Use the Skip button to cancel a step in the future, or Cancel to terminate the currently running one. The step's status will change to cancelled. After that, the Import simply goes to the next stage. Metadata will still be extracted, but features related to the cancelled step will not be extracted or updated.
When an error happens, you can click the Error status in the relevant import stage, or the Check error message button, to see more details.
Calendar
The Calendar tab displays task execution logs, including:
- past executions
- ongoing executions
- future (planned) executions
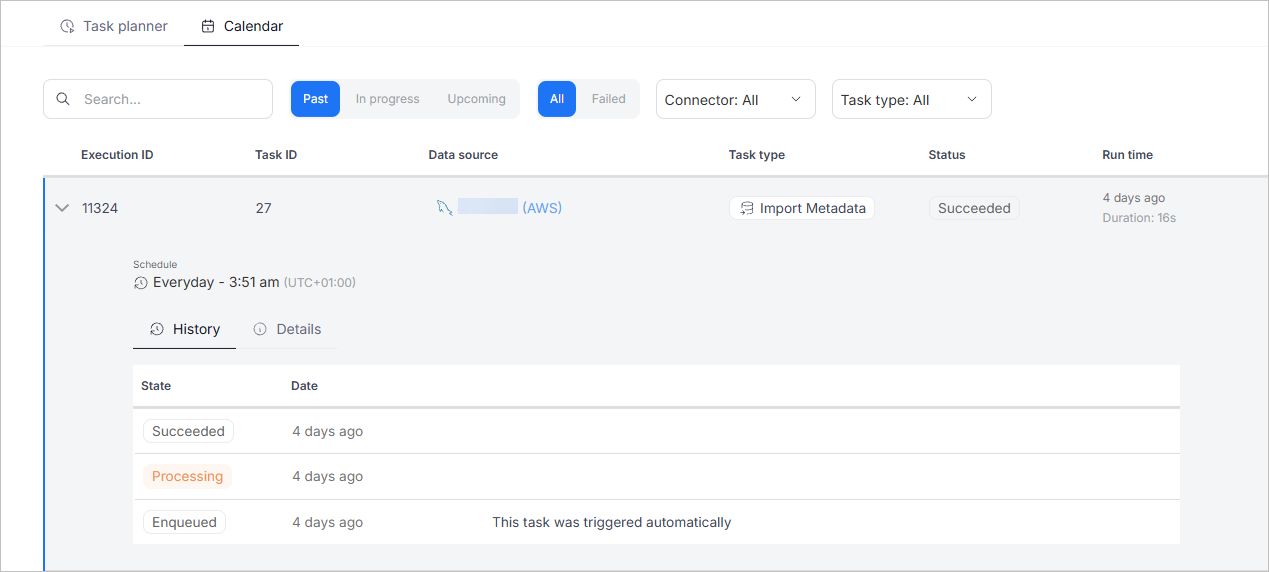
Search and Filter
You can filter executions by:
- Progress status: Past, In Progress, Upcoming.
- Execution status: All, Failed.
- Connector.
- Task type.
Tasks are grouped by execution ID. You can also search by Data Source name.
Note: Future tasks are based on estimated execution time. Actual times may vary depending on system load and Agent capacity.
Execution History
Each execution includes a log history. If an error occurs, detailed information and a stack trace are available to help with troubleshooting.
To view details for a failed task, click the error icon in the Calendar tab. A popup will show the error message and stack trace, which can be sent to support if needed.
Downloading the Execution log
You can also choose to download the execution log directly to your device. To do so, in the Calendar tab, find the past execution you are interested in, open the menu using the three dots icon and select Download log.

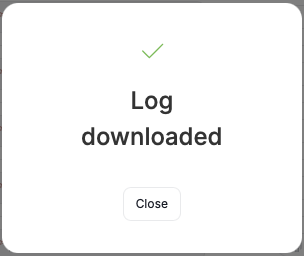
The execution can end with either a success or a failure. Failure happens if the log does not exist in the system. Dataedo will show you information regarding both outcomes.
Execution log download status
The downloaded log's title is formatted as follows: date of execution + execution ID + data source name.
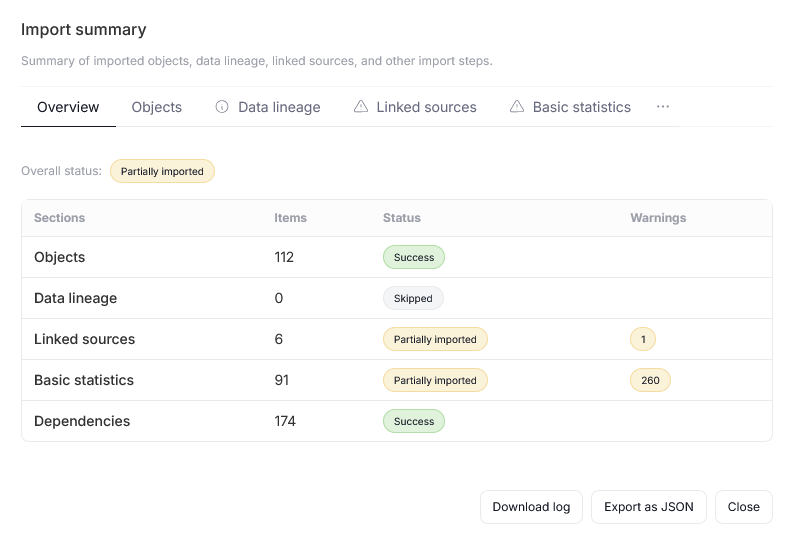
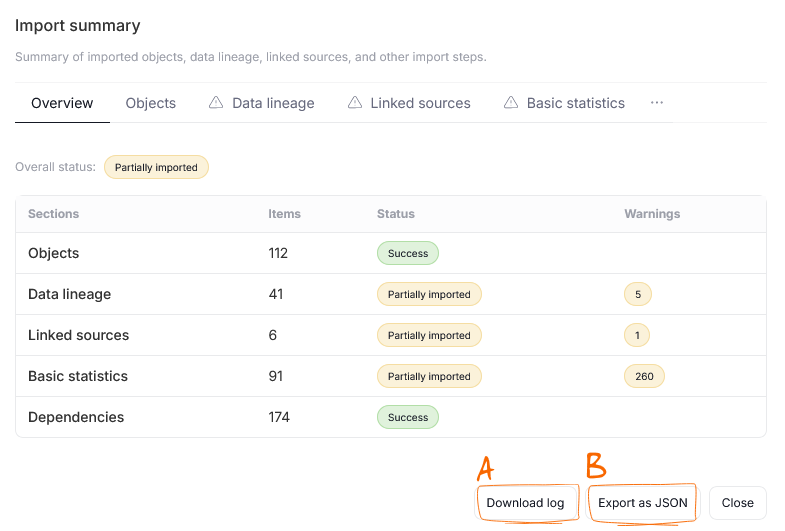
Import Summary
Whenever an import task is finished, you can review its summary in the Scheduler's Calendar tab. The summary is meant as a quick overview of the number and types of assets that were successfully imported, rather than a troubleshooting method. You can use it to verify whether the assets you wanted to document were read properly.
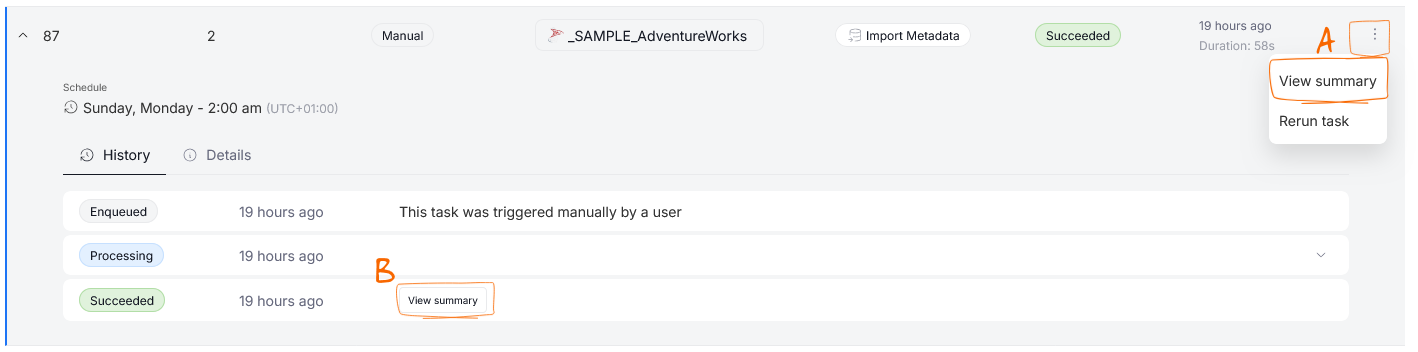
You can view the summary by:
- clicking the three dots icon next to a completed task and selecting import summary [A]
- expanding a task and selecting import summary in the bottom part of the task view [B]
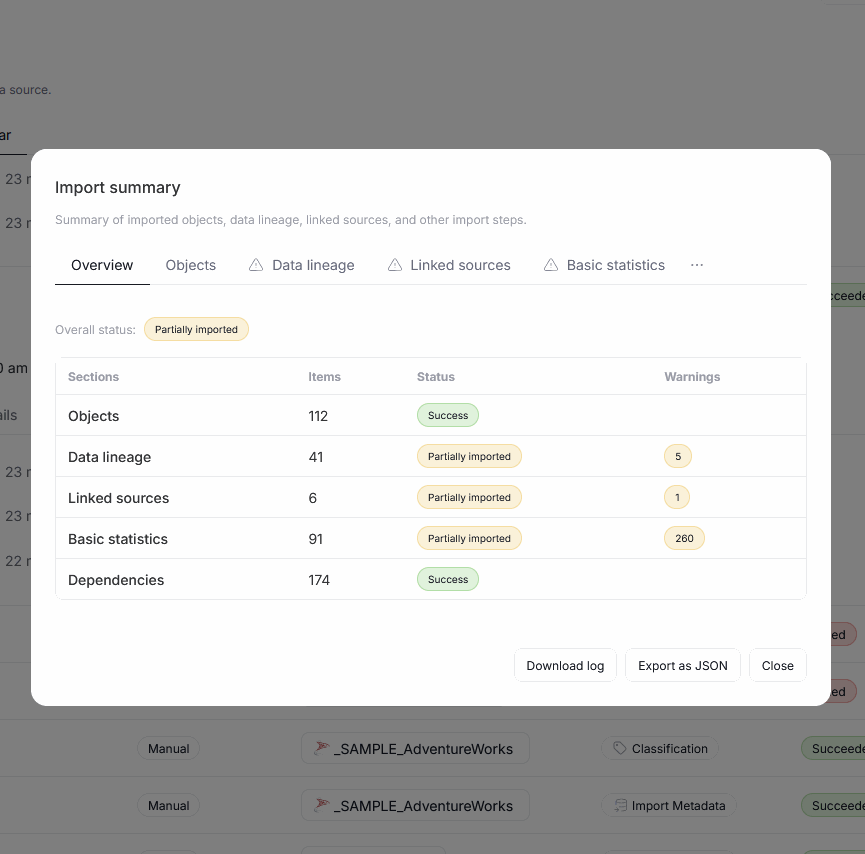
The Import Summary has a few tabs, some of them data-source dependent (for example, the Lineage tab will be visible only for sources supporting Automatic Lineage Extraction).
The first tab you will see for all Import Summaries is the Overview. Overview contains summarized information regarding every import category like objects, Lineage information, statistics, etc. For each category you can see the number of imported assets and the import's status. There is also a Warning column, containing information regarding asset types that caused issues during the import. Clicking the warning will take you directly to the relevant tab, where you can read exact warning messages in the form of short, actionable descriptions; for a more detailed warning and error summary, you would have to look at the log.
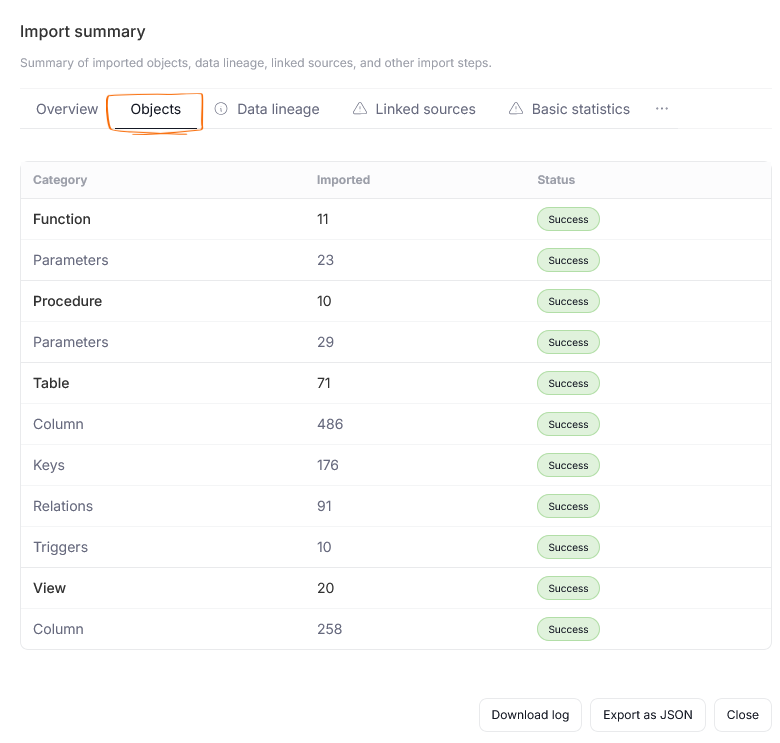
The Objects tab shows a breakdown of imported object types. Each object type has its separate section, with its other sub-objects (like columns, parameters, charts, etc.) listed as well. The number of imported objects per type is displayed in the Imported column. The Status column, on the other hand, shows whether these types could be properly imported, or if an error prevented them from being read.
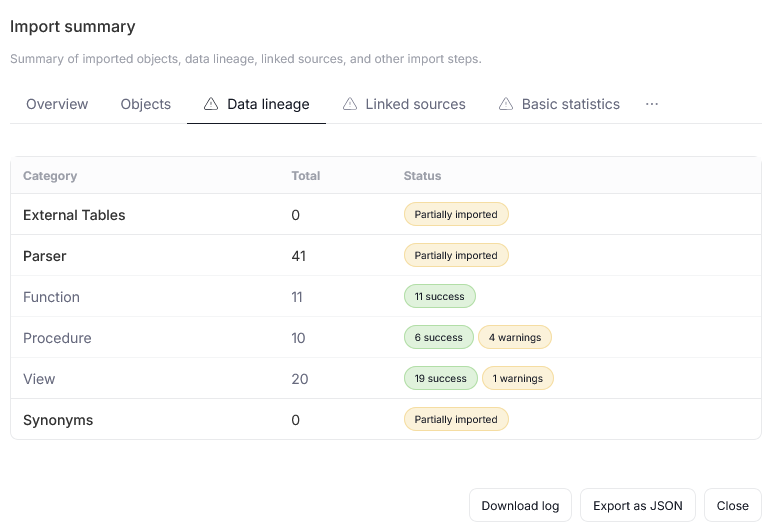
In the Data Lineage tab, you can see a numeric overview of imported objects that provide information about the data flow in your repository, together with the status of each object type's import.
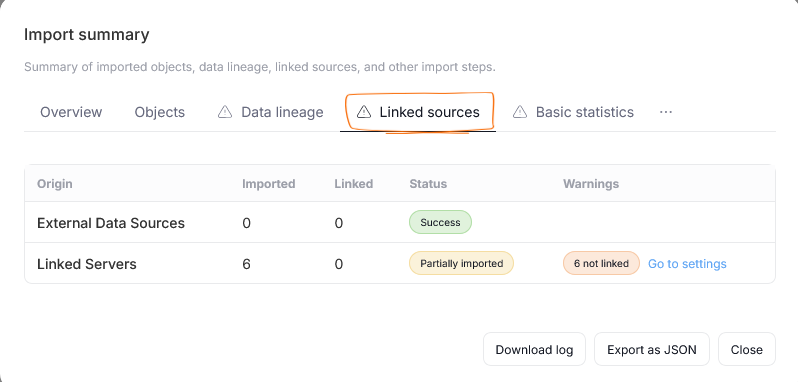
The Linked sources tab displays similar information about imported linked sources. There is an additional column there — Warnings — which lets you know if any linked sources present in your original data source are not properly mapped in Dataedo.
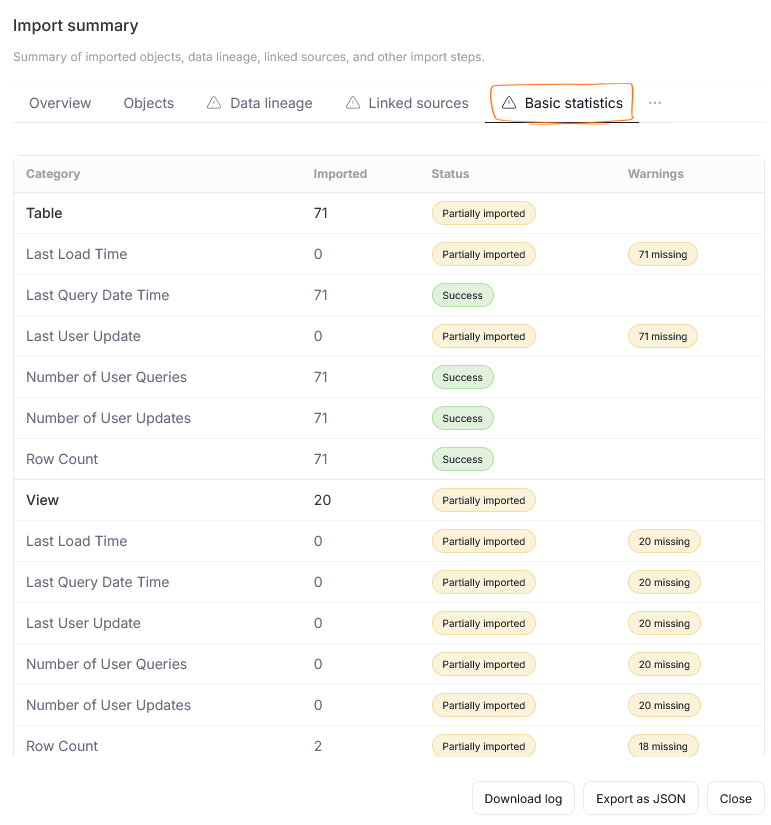
The Basic Statistics and Dependencies tabs are available only for selected objects. They display a numeric overview of query statistics and of stored functions, procedures, and triggers, respectively.
Other tabs
At the bottom of the Import Summary, you can either Download log [A], or export the summary as a JSON file using the Export as JSON button. The resulting JSON file contains all the information from your report summary, in a format that can easily be shared and used outside of Dataedo's context.
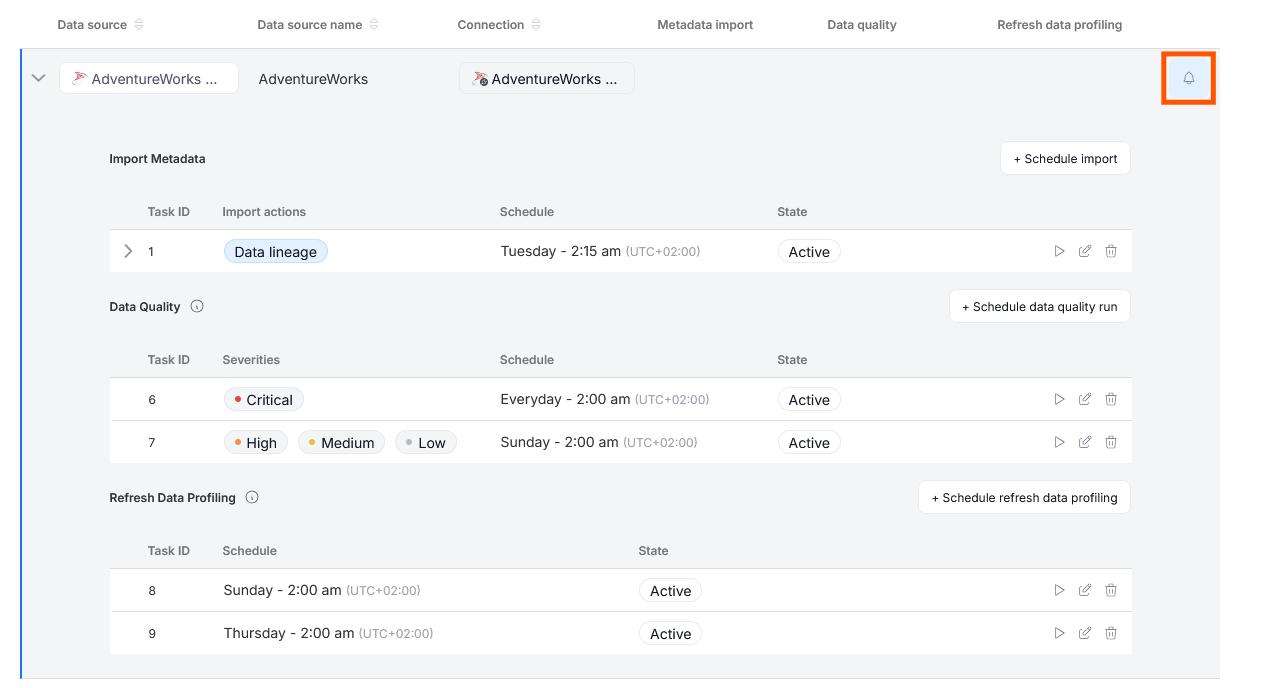
Scheduled tasks notifications
Enabling notifications from the Scheduler simply serves as a shortcut. Following the object normally will still subscribe you to notifications about its task, provided your account settings allow for that.
You can enable notifications for your scheduled tasks directly from the Scheduler. Click the bell icon next to an object with a scheduled task. If your notification settings allow that, you will receive notifications about that task's errors or failures via email and Portal.
The notification system and configuring your notifications is explained in more depth in our dedicated article.
Agent Status Indicators
Banners may appear in the Scheduler or Calendar views to indicate issues with the Agent:
- Agent not installed.
- Agent version mismatch.
- Agent cannot connect to the repository (for example, due to firewall or configuration issues).

